

622
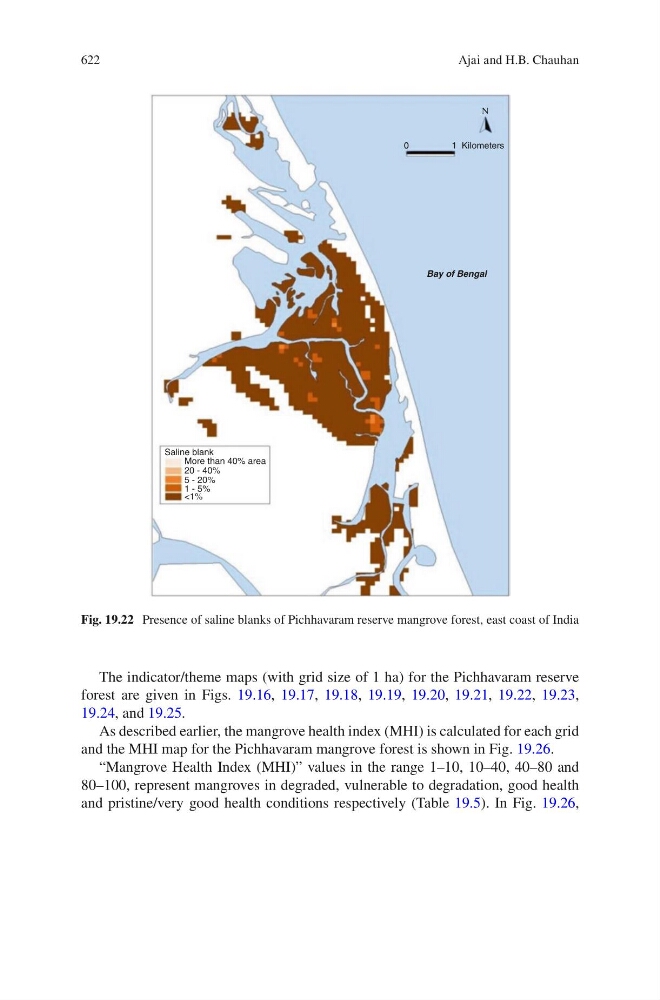
The indicator/theme maps (with grid size of 1 ha) for the Pichhavaram reserve
forest are given in Figs. 19.16, 19.17, 19.18, 19.19, 19.20, 19.21, 19.22, 19.23,
19.24, and 19.25.
As described earlier, the mangrove health index (MHI) is calculated for each grid
and the MHI map for the Pichhavaram mangrove forest is shown in Fig. 19.26.
“Mangrove Health Index (MHI)” values in the range 1–10, 10–40, 40–80 and
80–100, represent mangroves in degraded, vulnerable to degradation, good health
and pristine/very good health conditions respectively (Table 19.5). In Fig. 19.26,
0
1Kilometers
N
Bay of Bengal
Saline blank
More than 40% area
20 - 40%
5 - 20%
1 - 5%
<1%
Fig. 19.22 Presence of saline blanks of Pichhavaram reserve mangrove forest, east coast of India
Ajai and H.B. Chauhan