

593
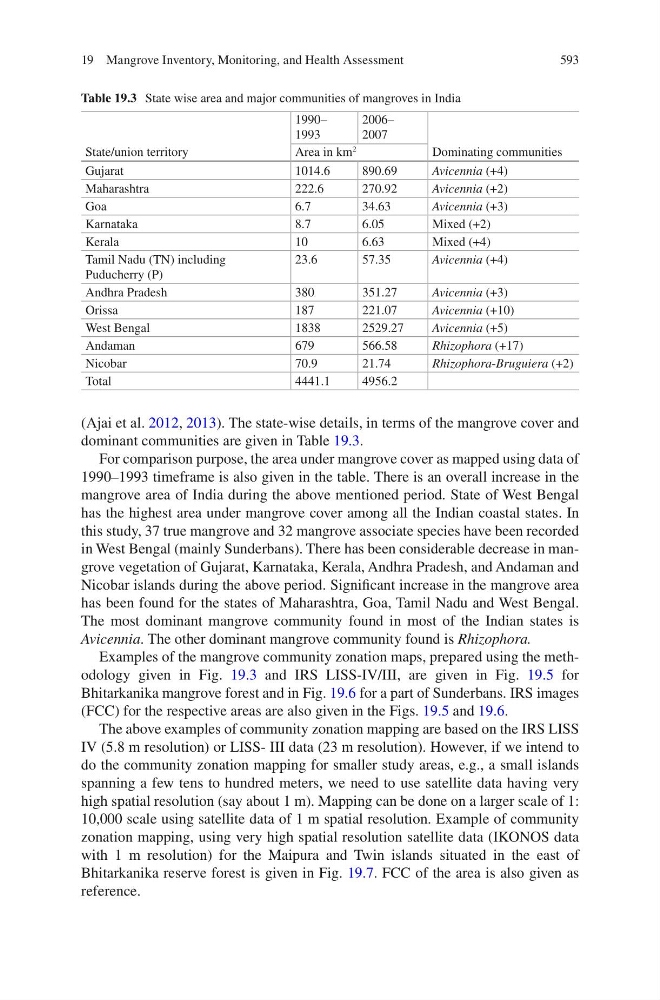
(Ajai et al. 2012, 2013). The state-wise details, in terms of the mangrove cover and
dominant communities are given in Table 19.3.
For comparison purpose, the area under mangrove cover as mapped using data of
1990–1993 timeframe is also given in the table. There is an overall increase in the
mangrove area of India during the above mentioned period. State of West Bengal
has the highest area under mangrove cover among all the Indian coastal states. In
this study, 37 true mangrove and 32 mangrove associate species have been recorded
in West Bengal (mainly Sunderbans). There has been considerable decrease in mangrove vegetation of Gujarat, Karnataka, Kerala, Andhra Pradesh, and Andaman and
Nicobar islands during the above period. Significant increase in the mangrove area
has been found for the states of Maharashtra, Goa, Tamil Nadu and West Bengal.
The most dominant mangrove community found in most of the Indian states is
Avicennia. The other dominant mangrove community found is Rhizophora.
Examples of the mangrove community zonation maps, prepared using the methodology given in Fig. 19.3 and IRS LISS-IV/III, are given in Fig. 19.5 for
Bhitarkanika mangrove forest and in Fig. 19.6 for a part of Sunderbans. IRS images
(FCC) for the respective areas are also given in the Figs. 19.5 and 19.6.
The above examples of community zonation mapping are based on the IRS LISS
IV (5.8 m resolution) or LISS- III data (23 m resolution). However, if we intend to
do the community zonation mapping for smaller study areas, e.g., a small islands
spanning a few tens to hundred meters, we need to use satellite data having very
high spatial resolution (say about 1 m). Mapping can be done on a larger scale of 1:
10,000 scale using satellite data of 1 m spatial resolution. Example of community
zonation mapping, using very high spatial resolution satellite data (IKONOS data
with 1 m resolution) for the Maipura and Twin islands situated in the east of
Bhitarkanika reserve forest is given in Fig. 19.7. FCC of the area is also given as
reference.
Table 19.3 State wise area and major communities of mangroves in India
State/union territory
1990–
1993
2006–
2007
Dominating communities
Area in km
2
Gujarat
1014.6
890.69
Avicennia (+4)
Maharashtra
222.6
270.92
Avicennia (+2)
Goa
6.7
34.63
Avicennia (+3)
Karnataka
8.7
6.05
Mixed (+2)
Kerala
10
6.63
Mixed (+4)
Tamil Nadu (TN) including
Puducherry (P)
23.6
57.35
Avicennia (+4)
Andhra Pradesh
380
351.27
Avicennia (+3)
Orissa
187
221.07
Avicennia (+10)
West Bengal
1838
2529.27
Avicennia (+5)
Andaman
679
566.58
Rhizophora (+17)
Nicobar
70.9
21.74
Rhizophora-Bruguiera (+2)
Total
4441.1
4956.2
19 Mangrove Inventory, Monitoring, and Health Assessment