

546
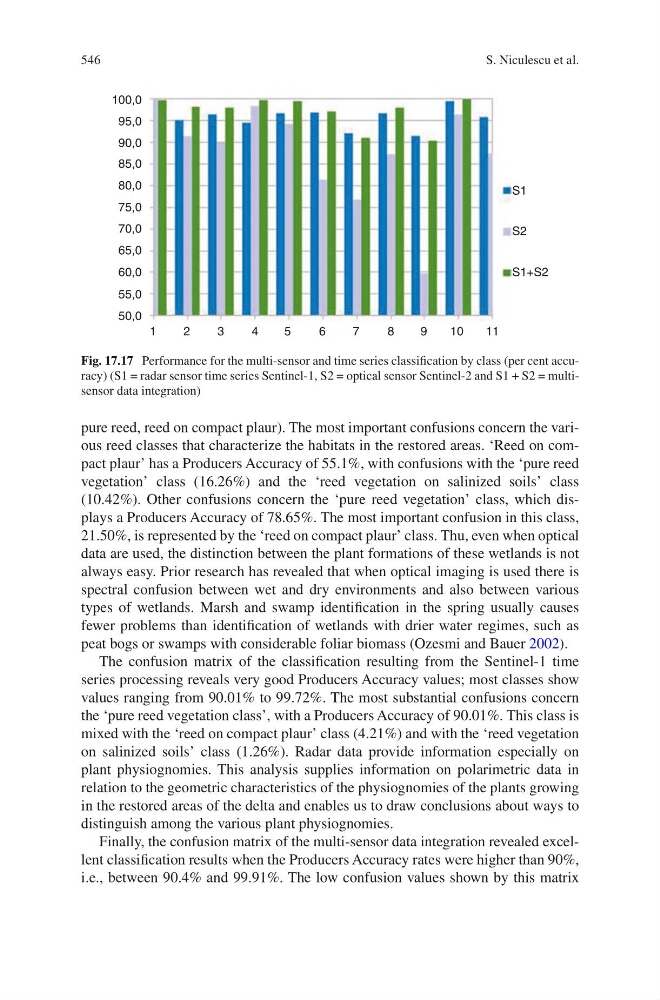
pure reed, reed on compact plaur). The most important confusions concern the various reed classes that characterize the habitats in the restored areas. ‘Reed on compact plaur’ has a Producers Accuracy of 55.1%, with confusions with the ‘pure reed
vegetation’ class (16.26%) and the ‘reed vegetation on salinized soils’ class
(10.42%). Other confusions concern the ‘pure reed vegetation’ class, which displays a Producers Accuracy of 78.65%. The most important confusion in this class,
21.50%, is represented by the ‘reed on compact plaur’ class. Thu, even when optical
data are used, the distinction between the plant formations of these wetlands is not
always easy. Prior research has revealed that when optical imaging is used there is
spectral confusion between wet and dry environments and also between various
types of wetlands. Marsh and swamp identification in the spring usually causes
fewer problems than identification of wetlands with drier water regimes, such as
peat bogs or swamps with considerable foliar biomass (Ozesmi and Bauer 2002).
The confusion matrix of the classification resulting from the Sentinel-1 time
series processing reveals very good Producers Accuracy values; most classes show
values ranging from 90.01% to 99.72%. The most substantial confusions concern
the ‘pure reed vegetation class’, with a Producers Accuracy of 90.01%. This class is
mixed with the ‘reed on compact plaur’ class (4.21%) and with the ‘reed vegetation
on salinized soils’ class (1.26%). Radar data provide information especially on
plant physiognomies. This analysis supplies information on polarimetric data in
relation to the geometric characteristics of the physiognomies of the plants growing
in the restored areas of the delta and enables us to draw conclusions about ways to
distinguish among the various plant physiognomies.
Finally, the confusion matrix of the multi-sensor data integration revealed excellent classification results when the Producers Accuracy rates were higher than 90%,
i.e., between 90.4% and 99.91%. The low confusion values shown by this matrix
100,0
95,0
85,0
75,0
65,0
55,0
50,0
60,0
70,0
90,0
80,0
1
2
3
4
5
6
7
8
9
10
11
S1
S2
S1+S2
Fig. 17.17 Performance for the multi-sensor and time series classification by class (per cent accuracy) (S1 = radar sensor time series Sentinel-1, S2 = optical sensor Sentinel-2 and S1 + S2 = multisensor data integration)
S. Niculescu et al.