

545
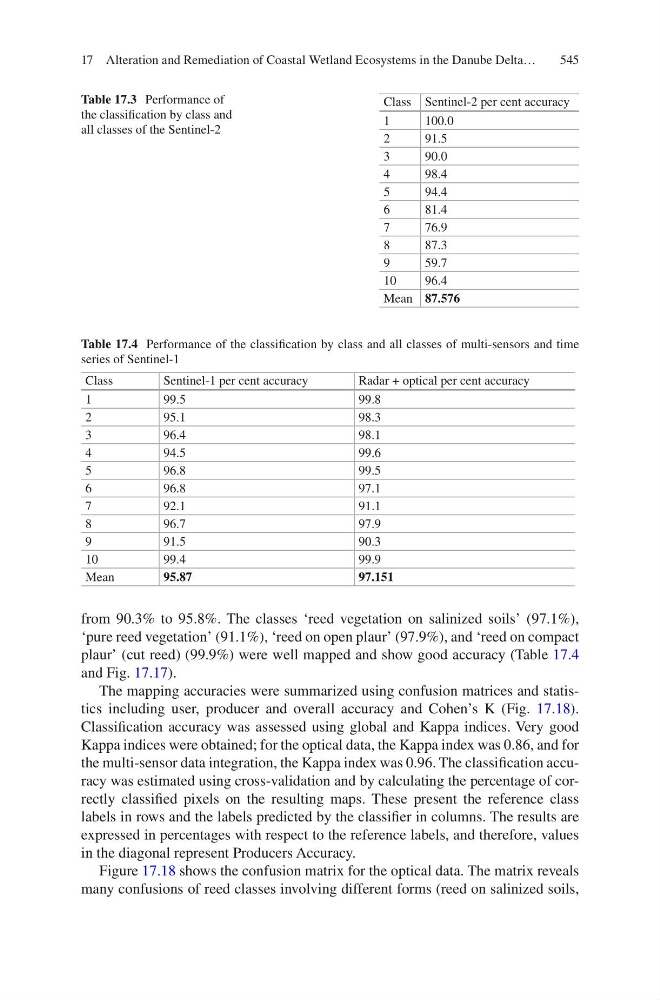
from 90.3% to 95.8%. The classes ‘reed vegetation on salinized soils’ (97.1%),
‘pure reed vegetation’ (91.1%), ‘reed on open plaur’ (97.9%), and ‘reed on compact
plaur’ (cut reed) (99.9%) were well mapped and show good accuracy (Table 17.4
and Fig. 17.17).
The mapping accuracies were summarized using confusion matrices and statistics including user, producer and overall accuracy and Cohen’s K (Fig. 17.18).
Classification accuracy was assessed using global and Kappa indices. Very good
Kappa indices were obtained; for the optical data, the Kappa index was 0.86, and for
the multi-sensor data integration, the Kappa index was 0.96. The classification accuracy was estimated using cross-validation and by calculating the percentage of correctly classified pixels on the resulting maps. These present the reference class
labels in rows and the labels predicted by the classifier in columns. The results are
expressed in percentages with respect to the reference labels, and therefore, values
in the diagonal represent Producers Accuracy.
Figure 17.18 shows the confusion matrix for the optical data. The matrix reveals
many confusions of reed classes involving different forms (reed on salinized soils,
Table 17.3 Performance of
the classification by class and
all classes of the Sentinel-2
Class Sentinel-2 per cent accuracy
1
100.0
2
91.5
3
90.0
4
98.4
5
94.4
6
81.4
7
76.9
8
87.3
9
59.7
10
96.4
Mean 87.576
Table 17.4 Performance of the classification by class and all classes of multi-sensors and time
series of Sentinel-1
Class
Sentinel-1 per cent accuracy
Radar + optical per cent accuracy
1
99.5
99.8
2
95.1
98.3
3
96.4
98.1
4
94.5
99.6
5
96.8
99.5
6
96.8
97.1
7
92.1
91.1
8
96.7
97.9
9
91.5
90.3
10
99.4
99.9
Mean
95.87
97.151
17 Alteration and Remediation of Coastal Wetland Ecosystems in the Danube Delta…