

540
A typical processing sequence applied to SAR data entails radiometric calibration, speckle filtering, and orthorectification. Radar signals require pre-processing
to account for geometric distortions and for differences in illumination conditions
due to topography and the surface being illuminated to one side of the satellite. An
additional step is needed to remove noise caused by reflections from features that
are not of interest. This is called speckle noise and is removed by a process called
speckle filtering. The filtering applied is filtering of the Lee type (Fig. 17.14).
Adaptive filters use local statistics to filter the data and so reduce image speckle and,
in some cases, preserve or enhance edges and other features. At the same time, the
backscattering coefficient was analyzed for the two different polarizations depending on a set of parameters related, on the one hand, to the RSO characteristics
(acquisition frequency, polarization and geometry) and, on the other hand, to the
attributes of the target (geometric structure, dielectric constant, biomass, etc.). The
backscattering coefficient is usually expressed in decibels (dB), yielding a normalized value comparing the observed power to the rated power for an equivalent 1-m
2
surface and corresponding to the distance to the ground. The backscattering coefficient is also very much influenced by factors related to the sensor configuration and
collection geometry.
The optical image (Sentinel-2) was already orthorectified in the UTM 35N cartographic system by ESA (level 1C). The geometric correction of image data is an
important prerequisite that must be performed prior to using images in geographic
information systems (GIS) and other image-processing programs. To process the
data with other data (radar) or maps in a GIS, all the data must be based on the same
reference system. Using a combination of different sensors, we resampled the data
to the smallest pixel size between optical and radar. All the datasets were orthorectified, resampled to a 10-m pixel size and separately classified.
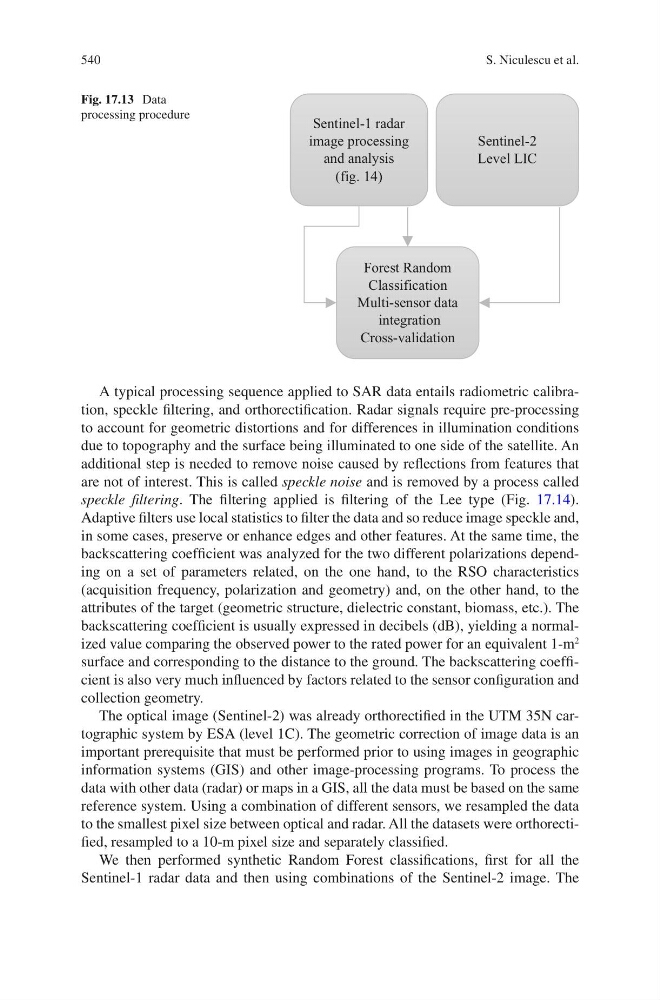
We then performed synthetic Random Forest classifications, first for all the
Sentinel-1 radar data and then using combinations of the Sentinel-2 image. The
Sentinel-1 radar
image processing
and analysis
(fig. 14)
Sentinel-2
Level LIC
Forest Random
Classification
Multi-sensor data
integration
Cross-validation
Fig. 17.13 Data
processing procedure
S. Niculescu et al.