

300
9.5.3 Calibration of the Numerical Model
Calibration of the numerical models ensures that modelling results approaching to
ocean-atmospheric conditions present in the study zone. For this project, it was used
reference information which allows calibrating the hydrodynamic and wave model.
Besides, it was used information of levels variations of the limnimetric station of
Casa Pilotos (Fig. 9.19) and wave information available of the directional buoy
closer to the study area used by the Maritime General Direction (DIMAR), in spanish), . For the calibration of the morphodynamic model, a longitudinal transect of
these seabed within the access channel of Magdalena River was used.
Hydrodynamic calibration results according to the variations of sea level
(Fig. 9.19) demonstrate a large adjustment between measured and modelled data.
Despite available in situ information is subject to diverse processes and variations
such as the flow, waves and the wind, it was possible to hourly simulate the variations
of the sea level during a 4 months period. Based on the characterization of the astronomic tide, previously made, it was observed a pattern of mixed semidiurnal tide.
Results of wave calibration (Fig. 9.20), made possible to approximately reproduce the variation of the significant wave height of the study area, evidenced by the
comparison between the variation of the significant wave height measured by the
buoy, and the results simulated by the model. Based on the above mentioned and the
general behaviour of time series, it was possible to adapt the numerical model to
represent the conditions of average wave of the study zone.
After calibrating the hydro-morphodynamic model is necessary to identify the representatives modelling scenarios for the analysis of oceanographic conditions of the study
zone, for purposes of establish the diagnosis of erosion problems of the coastal zone.
Consequently, the analysis of the hydro-morphodynamic analysis in 2010 was
focused on characterized climate seasons of the study zone: Dry (February); Humid
(October) (CIOH 2010), and according to the highest and lowest tides of each season, predefined from the Grenoble Model (Le Provost et al. 1994).
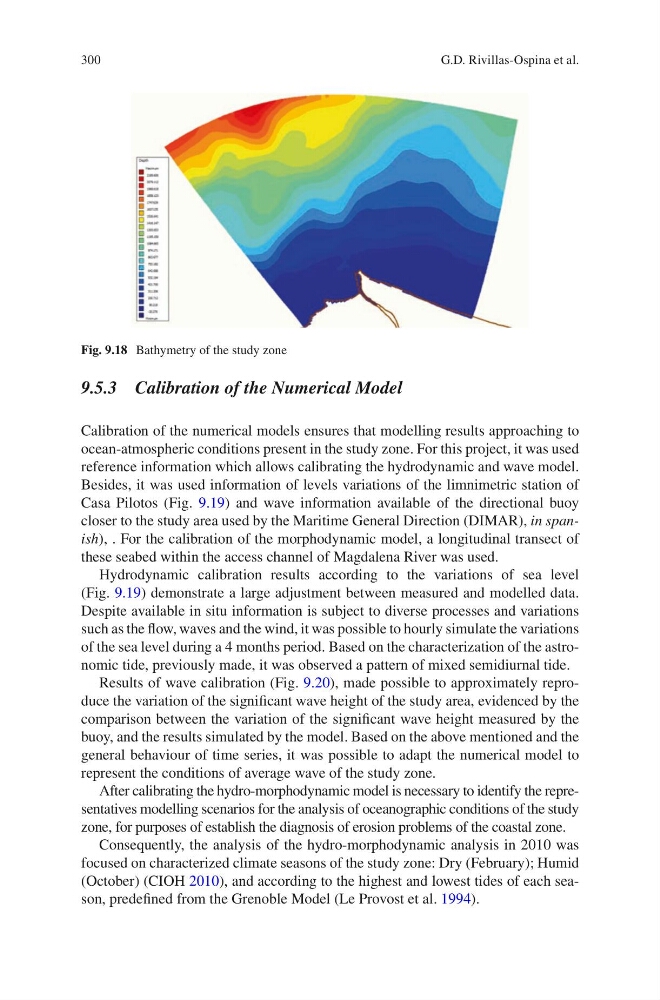
Fig. 9.18 Bathymetry of the study zone
G.D. Rivillas-Ospina et al.
9.5.3 Calibration of the Numerical Model
Calibration of the numerical models ensures that modelling results approaching to
ocean-atmospheric conditions present in the study zone. For this project, it was used
reference information which allows calibrating the hydrodynamic and wave model.
Besides, it was used information of levels variations of the limnimetric station of
Casa Pilotos (Fig. 9.19) and wave information available of the directional buoy
closer to the study area used by the Maritime General Direction (DIMAR), in spanish), . For the calibration of the morphodynamic model, a longitudinal transect of
these seabed within the access channel of Magdalena River was used.
Hydrodynamic calibration results according to the variations of sea level
(Fig. 9.19) demonstrate a large adjustment between measured and modelled data.
Despite available in situ information is subject to diverse processes and variations
such as the flow, waves and the wind, it was possible to hourly simulate the variations
of the sea level during a 4 months period. Based on the characterization of the astronomic tide, previously made, it was observed a pattern of mixed semidiurnal tide.
Results of wave calibration (Fig. 9.20), made possible to approximately reproduce the variation of the significant wave height of the study area, evidenced by the
comparison between the variation of the significant wave height measured by the
buoy, and the results simulated by the model. Based on the above mentioned and the
general behaviour of time series, it was possible to adapt the numerical model to
represent the conditions of average wave of the study zone.
After calibrating the hydro-morphodynamic model is necessary to identify the representatives modelling scenarios for the analysis of oceanographic conditions of the study
zone, for purposes of establish the diagnosis of erosion problems of the coastal zone.
Consequently, the analysis of the hydro-morphodynamic analysis in 2010 was
focused on characterized climate seasons of the study zone: Dry (February); Humid
(October) (CIOH 2010), and according to the highest and lowest tides of each season, predefined from the Grenoble Model (Le Provost et al. 1994).
Fig. 9.18 Bathymetry of the study zone
G.D. Rivillas-Ospina et al.