

301
9.5.4 Dry Season: February
9.5.4.1 Coastal Currents
The velocity rate in surface during the phase of high tide describes paths dominated
by the river in the estuary zone (Fig. 9.21a). There is a vectors change due to the
wave action and the diffraction phenomena that is generated in the edge of the groin,
reaching speeds of the order of 1.6 m/s. Subsequently, they flow in the current direction, reducing the speed up to 0.3 m/s and align with bathymetric contours to initiate
the movement in a south-westerly direction.
0.6
0.55
0.45
0.35
0.25
0.15
0.2
0.1
0.5
0.4
0.3
02/01
03/01
0 4/01
in situ
model
data (mm/dd)
height (mm)
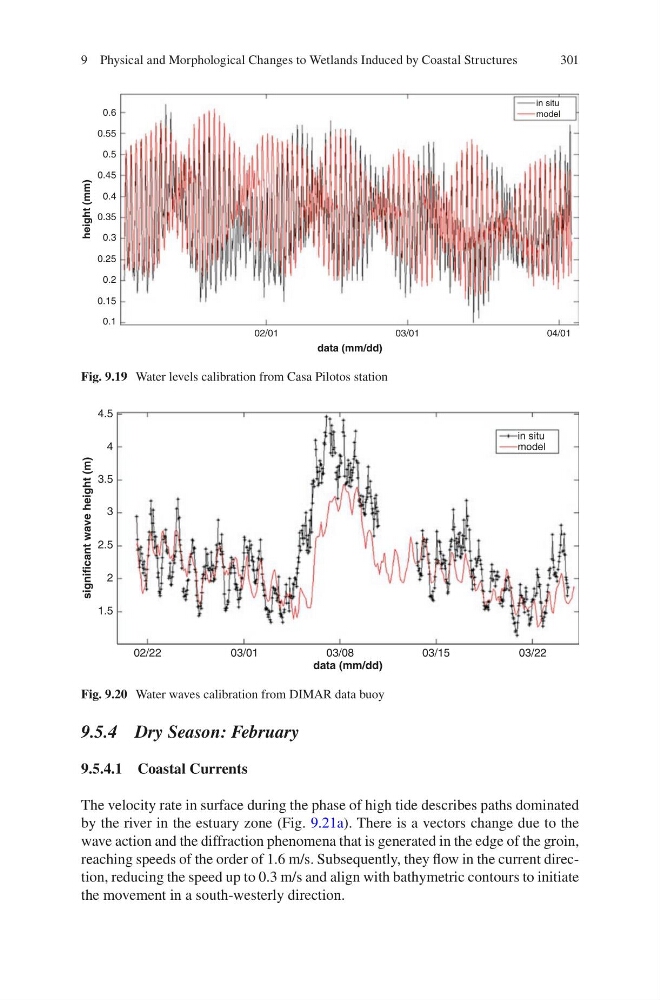
Fig. 9.19 Water levels calibration from Casa Pilotos station
4.5
3.5
3
2.5
1.5
2
02/22
03/01
03/08
03/15
in situ
model
03/22
4
data (mm/dd)
significant wave height (m)
Fig. 9.20 Water waves calibration from DIMAR data buoy
9 Physical and Morphological Changes to Wetlands Induced by Coastal Structures
9.5.4 Dry Season: February
9.5.4.1 Coastal Currents
The velocity rate in surface during the phase of high tide describes paths dominated
by the river in the estuary zone (Fig. 9.21a). There is a vectors change due to the
wave action and the diffraction phenomena that is generated in the edge of the groin,
reaching speeds of the order of 1.6 m/s. Subsequently, they flow in the current direction, reducing the speed up to 0.3 m/s and align with bathymetric contours to initiate
the movement in a south-westerly direction.
0.6
0.55
0.45
0.35
0.25
0.15
0.2
0.1
0.5
0.4
0.3
02/01
03/01
0 4/01
in situ
model
data (mm/dd)
height (mm)
Fig. 9.19 Water levels calibration from Casa Pilotos station
4.5
3.5
3
2.5
1.5
2
02/22
03/01
03/08
03/15
in situ
model
03/22
4
data (mm/dd)
significant wave height (m)
Fig. 9.20 Water waves calibration from DIMAR data buoy
9 Physical and Morphological Changes to Wetlands Induced by Coastal Structures