

294
9.4.2.1 Virtual Buoy 11.5 °N −74.5 °W
It can develop a mean regimen analysis of waves to analyse the behaviour of the
maritime climate in a coastal wetland. For this, it analyses the probability of any
storm is overcome in medium time. Besides, it is possible to classify physical variables by a joint probability analysis in order to characterize the phenomena magnitude with its persistence in different season of the year. This allows construction
waves and wind roses and frequency histograms.
The potential of bars erosion that protect wetlands can be determined by an analysis of unfavourable weather conditions, known as extreme analysis. This is focused
on the events characterization that have the larger energetic amount and that also,
generate drastic changes in littoral zones, appearing during each winter season.
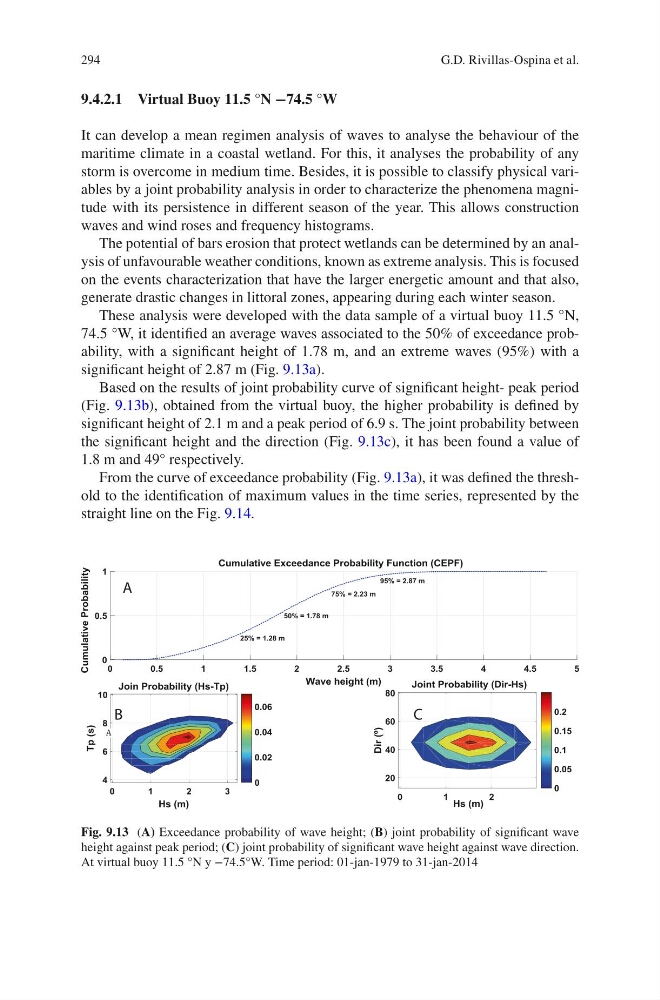
These analysis were developed with the data sample of a virtual buoy 11.5 °N,
74.5 °W, it identified an average waves associated to the 50% of exceedance probability, with a significant height of 1.78 m, and an extreme waves (95%) with a
significant height of 2.87 m (Fig. 9.13a).
Based on the results of joint probability curve of significant height- peak period
(Fig. 9.13b), obtained from the virtual buoy, the higher probability is defined by
significant height of 2.1 m and a peak period of 6.9 s. The joint probability between
the significant height and the direction (Fig. 9.13c), it has been found a value of
1.8 m and 49° respectively.
From the curve of exceedance probability (Fig. 9.13a), it was defined the threshold to the identification of maximum values in the time series, represented by the
straight line on the Fig. 9.14.
C
B
A
A
Fig. 9.13 (A) Exceedance probability of wave height; (B) joint probability of significant wave
height against peak period; (C) joint probability of significant wave height against wave direction.
At virtual buoy 11.5 °N y −74.5°W. Time period: 01-jan-1979 to 31-jan-2014
G.D. Rivillas-Ospina et al.
9.4.2.1 Virtual Buoy 11.5 °N −74.5 °W
It can develop a mean regimen analysis of waves to analyse the behaviour of the
maritime climate in a coastal wetland. For this, it analyses the probability of any
storm is overcome in medium time. Besides, it is possible to classify physical variables by a joint probability analysis in order to characterize the phenomena magnitude with its persistence in different season of the year. This allows construction
waves and wind roses and frequency histograms.
The potential of bars erosion that protect wetlands can be determined by an analysis of unfavourable weather conditions, known as extreme analysis. This is focused
on the events characterization that have the larger energetic amount and that also,
generate drastic changes in littoral zones, appearing during each winter season.
These analysis were developed with the data sample of a virtual buoy 11.5 °N,
74.5 °W, it identified an average waves associated to the 50% of exceedance probability, with a significant height of 1.78 m, and an extreme waves (95%) with a
significant height of 2.87 m (Fig. 9.13a).
Based on the results of joint probability curve of significant height- peak period
(Fig. 9.13b), obtained from the virtual buoy, the higher probability is defined by
significant height of 2.1 m and a peak period of 6.9 s. The joint probability between
the significant height and the direction (Fig. 9.13c), it has been found a value of
1.8 m and 49° respectively.
From the curve of exceedance probability (Fig. 9.13a), it was defined the threshold to the identification of maximum values in the time series, represented by the
straight line on the Fig. 9.14.
C
B
A
A
Fig. 9.13 (A) Exceedance probability of wave height; (B) joint probability of significant wave
height against peak period; (C) joint probability of significant wave height against wave direction.
At virtual buoy 11.5 °N y −74.5°W. Time period: 01-jan-1979 to 31-jan-2014
G.D. Rivillas-Ospina et al.