

295
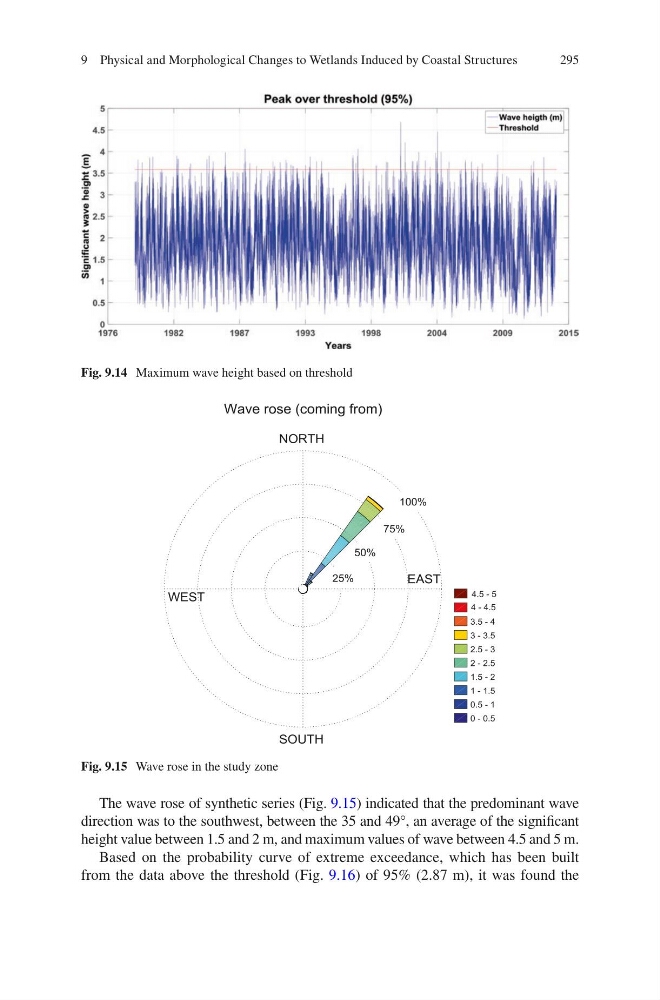
The wave rose of synthetic series (Fig. 9.15) indicated that the predominant wave
direction was to the southwest, between the 35 and 49°, an average of the significant
height value between 1.5 and 2 m, and maximum values of wave between 4.5 and 5 m.
Based on the probability curve of extreme exceedance, which has been built
from the data above the threshold (Fig. 9.16) of 95% (2.87 m), it was found the
Fig. 9.14 Maximum wave height based on threshold
Fig. 9.15 Wave rose in the study zone
9 Physical and Morphological Changes to Wetlands Induced by Coastal Structures
The wave rose of synthetic series (Fig. 9.15) indicated that the predominant wave
direction was to the southwest, between the 35 and 49°, an average of the significant
height value between 1.5 and 2 m, and maximum values of wave between 4.5 and 5 m.
Based on the probability curve of extreme exceedance, which has been built
from the data above the threshold (Fig. 9.16) of 95% (2.87 m), it was found the
Fig. 9.14 Maximum wave height based on threshold
Fig. 9.15 Wave rose in the study zone
9 Physical and Morphological Changes to Wetlands Induced by Coastal Structures