

Functional Responses to Thinning
..... 400
I VI
N
'E 300
(5
E 200
.s w 100
t)
Z
e(
lt)
::> 400
0
Z
0 300
u
-1
e( 200
le(
~
0 100
lf/)
0
June 1994
August 1994
9.00
12.00
15.00
9.00
12.00
15.00
Time, hours
- - CONTROL
- - - MINIMUM THINNING
MAXIMUM THINNING
A UPPER CANOPY
"'J LOW ER CANOPY
o RESPROUTS
335
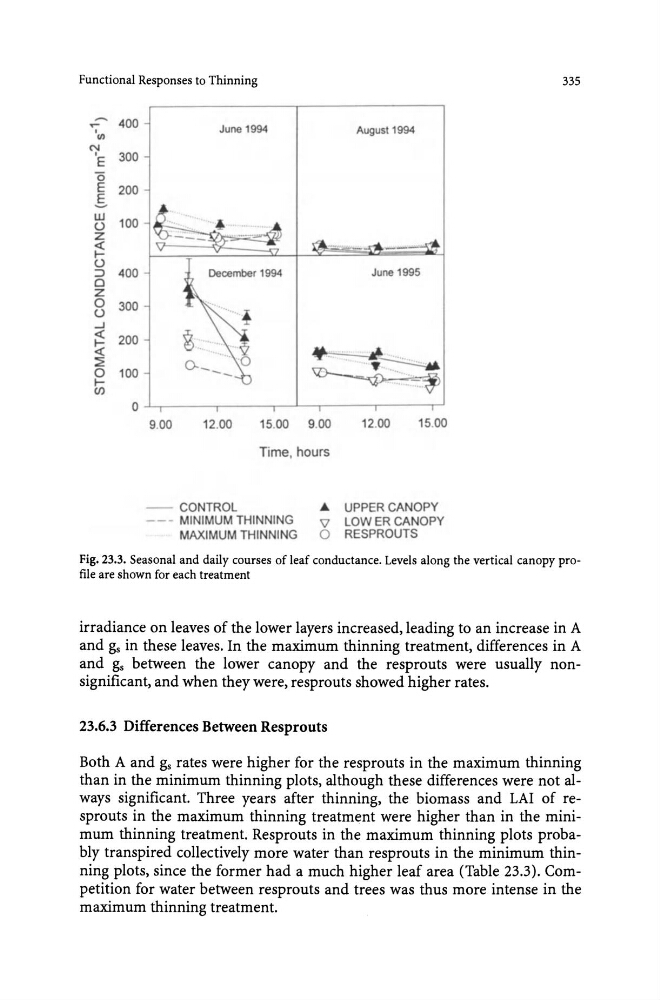
Fig. 23.3. Seasonal and daily courses of leaf conductance. Levels along the vertical canopy profile are shown for each treatment
irradiance on leaves of the lower layers increased, leading to an increase in A
and gs in these leaves. In the maximum thinning treatment, differences in A
and gs between the lower canopy and the resprouts were usually nonsignificant, and when they were, resprouts showed higher rates.
23.6.3 Differences Between Resprouts
Both A and gs rates were higher for the resprouts in the maximum thinning
than in the minimum thinning plots, although these differences were not always significant. Three years after thinning, the biomass and LAI of resprouts in the maximum thinning treatment were higher than in the minimum thinning treatment. Resprouts in the maximum thinning plots probably transpired collectively more water than resprouts in the minimum thinning plots, since the former had a much higher leaf area (Table 23.3). Competition for water between resprouts and trees was thus more intense in the
maximum thinning treatment.
..... 400
I VI
N
'E 300
(5
E 200
.s w 100
t)
Z
e(
lt)
::> 400
0
Z
0 300
u
-1
e( 200
le(
~
0 100
lf/)
0
June 1994
August 1994
9.00
12.00
15.00
9.00
12.00
15.00
Time, hours
- - CONTROL
- - - MINIMUM THINNING
MAXIMUM THINNING
A UPPER CANOPY
"'J LOW ER CANOPY
o RESPROUTS
335
Fig. 23.3. Seasonal and daily courses of leaf conductance. Levels along the vertical canopy profile are shown for each treatment
irradiance on leaves of the lower layers increased, leading to an increase in A
and gs in these leaves. In the maximum thinning treatment, differences in A
and gs between the lower canopy and the resprouts were usually nonsignificant, and when they were, resprouts showed higher rates.
23.6.3 Differences Between Resprouts
Both A and gs rates were higher for the resprouts in the maximum thinning
than in the minimum thinning plots, although these differences were not always significant. Three years after thinning, the biomass and LAI of resprouts in the maximum thinning treatment were higher than in the minimum thinning treatment. Resprouts in the maximum thinning plots probably transpired collectively more water than resprouts in the minimum thinning plots, since the former had a much higher leaf area (Table 23.3). Competition for water between resprouts and trees was thus more intense in the
maximum thinning treatment.