

334
9
S
~
7
..... ,
VI
6
N
5
, 4
E 3
'0 2
E 1
:1. 0
'-"
en -1
:r: 9
l- S
Z
>- 7
en 6
0 5
I- 4
0
:r: 3
a.. 2
1
0
-1
-2
Carlos A. Gracia, Santiago Sabate, Juan Manuel Martinez and Eva Albeza
August 1994
December 1994
June 1995
9.00
12.00
15.00
9.00
12.00
15.00
Time, hours
-
CONTROL
.. UPPER CANOPY
V
LOW ER CANOPY
o RESPROUTS
- - - MINIMUM THINNING
MAXIMUM THINNING
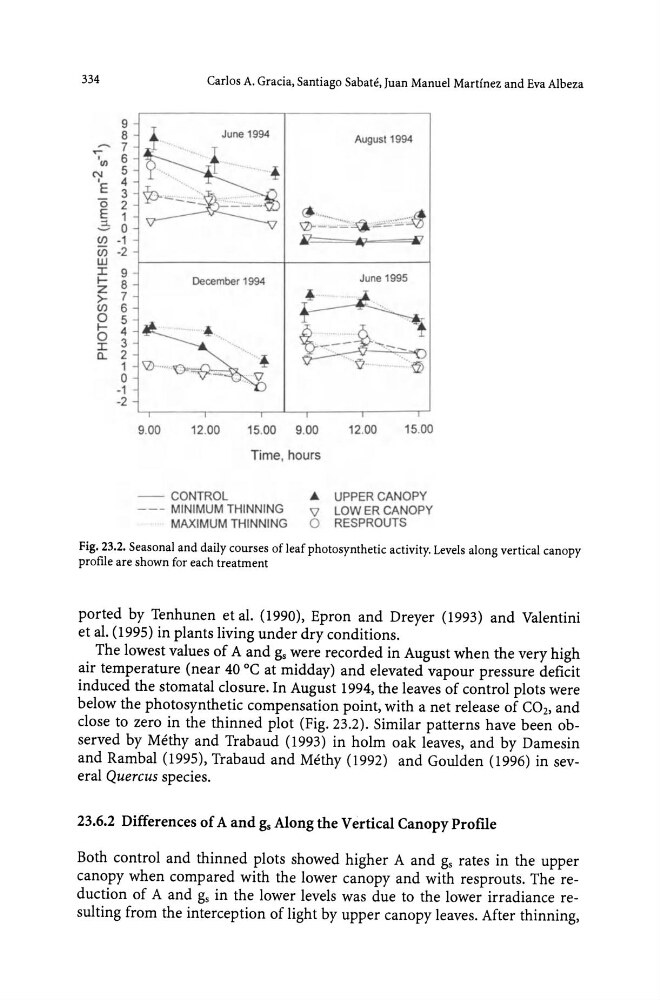
Fig. 23.2. Seasonal and daily courses of leaf photosynthetic activity. Levels along vertical canopy
profile are shown for each treatment
ported by Tenhunen et al. (1990), Epron and Dreyer (1993) and Valentini
et al. (1995) in plants living under dry conditions.
The lowest values of A and gs were recorded in August when the very high
air temperature (near 40°C at midday) and elevated vapour pressure deficit
induced the stomatal closure. In August 1994, the leaves of control plots were
below the photosynthetic compensation point, with a net release of CO2, and
close to zero in the thinned plot (Fig. 23.2). Similar patterns have been observed by Methy and Trabaud (1993) in holm oak leaves, and by Damesin
and Rambal (1995), Trabaud and Methy (1992) and Goulden (1996) in several Quercus species.
23.6.2 Differences of A and gs Along the Vertica! Canopy ProfIle
Both control and thinned plots showed higher A and gs rates in the upper
canopy when compared with the lower canopy and with resprouts. The reduction of A and gs in the lower levels was due to the lower irradiance resulting from the interception of light by upper canopy leaves. After thinning,
9
S
~
7
..... ,
VI
6
N
5
, 4
E 3
'0 2
E 1
:1. 0
'-"
en -1
:r: 9
l- S
Z
>- 7
en 6
0 5
I- 4
0
:r: 3
a.. 2
1
0
-1
-2
Carlos A. Gracia, Santiago Sabate, Juan Manuel Martinez and Eva Albeza
August 1994
December 1994
June 1995
9.00
12.00
15.00
9.00
12.00
15.00
Time, hours
-
CONTROL
.. UPPER CANOPY
V
LOW ER CANOPY
o RESPROUTS
- - - MINIMUM THINNING
MAXIMUM THINNING
Fig. 23.2. Seasonal and daily courses of leaf photosynthetic activity. Levels along vertical canopy
profile are shown for each treatment
ported by Tenhunen et al. (1990), Epron and Dreyer (1993) and Valentini
et al. (1995) in plants living under dry conditions.
The lowest values of A and gs were recorded in August when the very high
air temperature (near 40°C at midday) and elevated vapour pressure deficit
induced the stomatal closure. In August 1994, the leaves of control plots were
below the photosynthetic compensation point, with a net release of CO2, and
close to zero in the thinned plot (Fig. 23.2). Similar patterns have been observed by Methy and Trabaud (1993) in holm oak leaves, and by Damesin
and Rambal (1995), Trabaud and Methy (1992) and Goulden (1996) in several Quercus species.
23.6.2 Differences of A and gs Along the Vertica! Canopy ProfIle
Both control and thinned plots showed higher A and gs rates in the upper
canopy when compared with the lower canopy and with resprouts. The reduction of A and gs in the lower levels was due to the lower irradiance resulting from the interception of light by upper canopy leaves. After thinning,