

Functional Responses to Thinning
THINNING INTENSITY
o C IT1 M C IT1.M C IT1.M.Q IT1 M
-1
,..., -2
'"
c...
~
.".
0.....
III
'8.
c.::
3.".
~
0~
....
0:=
.....
u
-4
~
~
c.::
=;
~
~
~
Q
:J
«
-4.24
C Control
~ Upper Top
m Min. Thinning
~ LowerTop
M Max. Thinning
c:::::J Aesprouls
333
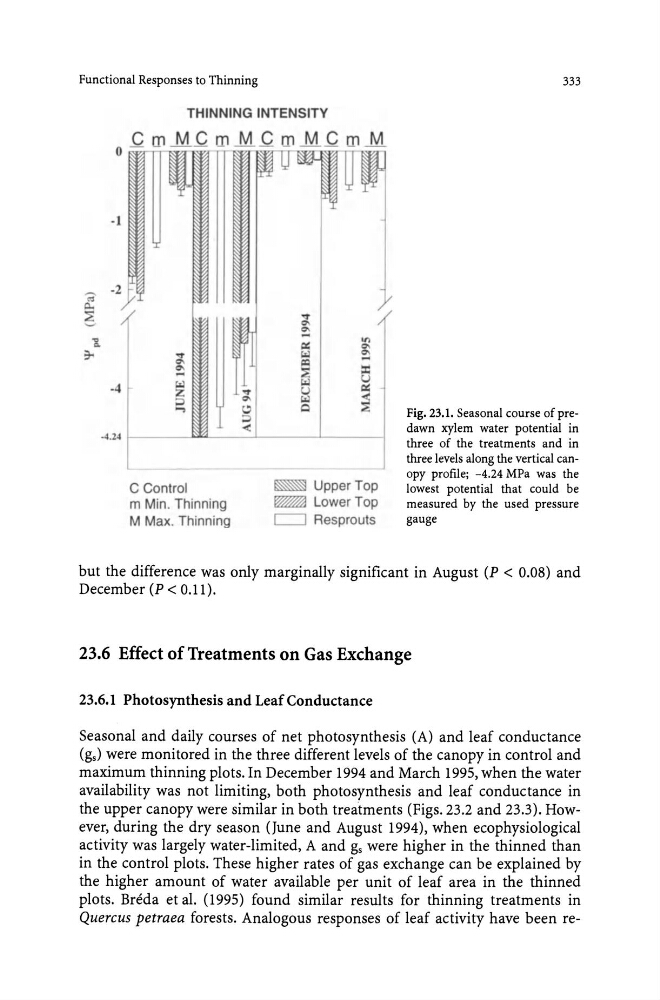
Fig. 23.1. Seasonal course of predawn xylem water potential in
three of the treatments and in
three levels along the vertical canopy profile; -4.24 MPa was the
lowest potential that could be
measured by the used pressure
gauge
but the difference was only marginally significant in August (P < 0.08) and
December (P < 0.11).
23.6 Effect of Treatments on Gas Exchange
23.6.1 Photosynthesis and Leaf Conductance
Seasonal and daily courses of net photosynthesis (A) and leaf conductance
(gs) were monitored in the three different levels of the canopy in control and
maximum thinning plots. In December 1994 and March 1995, when the water
availability was not limiting, both photosynthesis and leaf conductance in
the upper canopy were similar in both treatments (Figs. 23.2 and 23.3). However, during the dry season (June and August 1994), when ecophysiological
activity was largely water-limited, A and gs were higher in the thinned than
in the control plots. These higher rates of gas exchange can be explained by
the higher amount of water available per unit of leaf area in the thinned
plots. Breda et al. (1995) found similar results for thinning treatments in
Quercus petraea forests. Analogous responses of leaf activity have been re-
THINNING INTENSITY
o C IT1 M C IT1.M C IT1.M.Q IT1 M
-1
,..., -2
'"
c...
~
.".
0.....
III
'8.
c.::
3.".
~
0~
....
0:=
.....
u
-4
~
~
c.::
=;
~
~
~
Q
:J
«
-4.24
C Control
~ Upper Top
m Min. Thinning
~ LowerTop
M Max. Thinning
c:::::J Aesprouls
333
Fig. 23.1. Seasonal course of predawn xylem water potential in
three of the treatments and in
three levels along the vertical canopy profile; -4.24 MPa was the
lowest potential that could be
measured by the used pressure
gauge
but the difference was only marginally significant in August (P < 0.08) and
December (P < 0.11).
23.6 Effect of Treatments on Gas Exchange
23.6.1 Photosynthesis and Leaf Conductance
Seasonal and daily courses of net photosynthesis (A) and leaf conductance
(gs) were monitored in the three different levels of the canopy in control and
maximum thinning plots. In December 1994 and March 1995, when the water
availability was not limiting, both photosynthesis and leaf conductance in
the upper canopy were similar in both treatments (Figs. 23.2 and 23.3). However, during the dry season (June and August 1994), when ecophysiological
activity was largely water-limited, A and gs were higher in the thinned than
in the control plots. These higher rates of gas exchange can be explained by
the higher amount of water available per unit of leaf area in the thinned
plots. Breda et al. (1995) found similar results for thinning treatments in
Quercus petraea forests. Analogous responses of leaf activity have been re-