

A Model of Stand Dynamics for Holm Oak-Aleppo Pine Forests
113
technically named the eigenvalues of the Jacobian matrix of the monospecific system. A value greater than one indicates population expansion, one
indicates equilibrium and less than one indicates population decrease. Given
that the eigenvalues are functions of !-l and UJ, the qualitative dynamics of the
model in relation to these two variables can be studied by a combination of
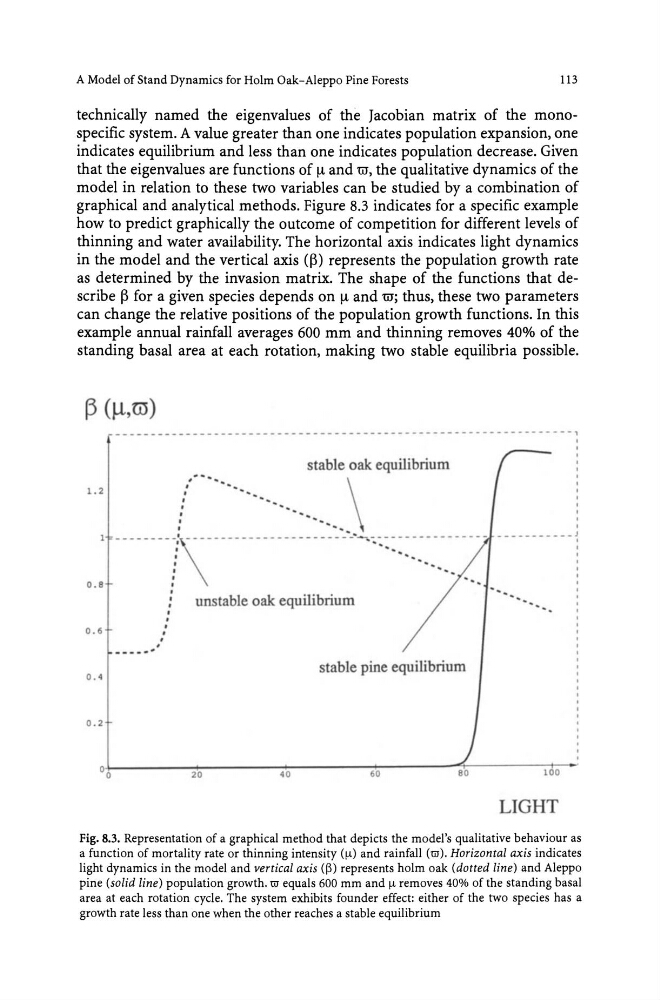
graphical and analytical methods. Figure 8.3 indicates for a specific example
how to predict graphically the outcome of competition for different levels of
thinning and water availability. The horizontal axis indicates light dynamics
in the model and the vertical axis (~) represents the population growth rate
as determined by the invasion matrix. The shape of the functions that describe ~ for a given species depends on !-l and UJ; thus, these two parameters
can change the relative positions of the population growth functions. In this
example annual rainfall averages 600 mm and thinning removes 40% of the
standing basal area at each rotation, making two stable equilibria possible.
f3 (Jl,m)
-----------------------------------------------------------------,
stable oak equilibrium
1. 2
" ......... . . .
·
·
·
'.
·
'.
•
1 ---------: --------_ ... _-----------"'-.... -
' .
0.8
0 . 6
--_ .....
0 . 4
0 . 2
.
.
,
.
·
·
•
·
·
•
·
'.
unstable oak equilibrium
stable pine eqUilibrium
20
40
60
100
LIGHT
Fig. 8.3. Representation of a graphical method that depicts the model's qualitative behaviour as
a function of mortality rate or thinning intensity (~) and rainfall (m). Horizontal axis indicates
light dynamics in the model and vertical axis (~) represents holm oak (dotted line) and Aleppo
pine (solid line) population growth.m equals 600 mm and ~ removes 40% of the standing basal
area at each rotation cycle. The system exhibits founder effect: either of the two species has a
growth rate less than one when the other reaches a stable equilibrium
113
technically named the eigenvalues of the Jacobian matrix of the monospecific system. A value greater than one indicates population expansion, one
indicates equilibrium and less than one indicates population decrease. Given
that the eigenvalues are functions of !-l and UJ, the qualitative dynamics of the
model in relation to these two variables can be studied by a combination of
graphical and analytical methods. Figure 8.3 indicates for a specific example
how to predict graphically the outcome of competition for different levels of
thinning and water availability. The horizontal axis indicates light dynamics
in the model and the vertical axis (~) represents the population growth rate
as determined by the invasion matrix. The shape of the functions that describe ~ for a given species depends on !-l and UJ; thus, these two parameters
can change the relative positions of the population growth functions. In this
example annual rainfall averages 600 mm and thinning removes 40% of the
standing basal area at each rotation, making two stable equilibria possible.
f3 (Jl,m)
-----------------------------------------------------------------,
stable oak equilibrium
1. 2
" ......... . . .
·
·
·
'.
·
'.
•
1 ---------: --------_ ... _-----------"'-.... -
' .
0.8
0 . 6
--_ .....
0 . 4
0 . 2
.
.
,
.
·
·
•
·
·
•
·
'.
unstable oak equilibrium
stable pine eqUilibrium
20
40
60
100
LIGHT
Fig. 8.3. Representation of a graphical method that depicts the model's qualitative behaviour as
a function of mortality rate or thinning intensity (~) and rainfall (m). Horizontal axis indicates
light dynamics in the model and vertical axis (~) represents holm oak (dotted line) and Aleppo
pine (solid line) population growth.m equals 600 mm and ~ removes 40% of the standing basal
area at each rotation cycle. The system exhibits founder effect: either of the two species has a
growth rate less than one when the other reaches a stable equilibrium