

496
F.I. Woodward and T.M. Smith
23.3.3 Results
The relationship between N uptake by the whole plant and Amax is well
described by a linear regression (Fig. 23.2, r = 0.949, n = 14). In general,
when plants were grown in soils from which they did not originate, then
mycorrhizal development was poorer than on their native soils and, in
addition, the growth of the ericoid and ectomycorrhizal species was poor.
Therefore, the data from these plants have not been included here.
The one regression covers four major soil and mycorrhizal types from
high nutrients and nonmycorrhizal, through vesicular-arbuscular mycorrhizal
to low quality and high refractory N soils with ectomycorrhizal and ericoid
mycorrhizal associations. The relationship supports the hypothesis that Amax
increases with the rate of N uptake and with a decreased reliance on the
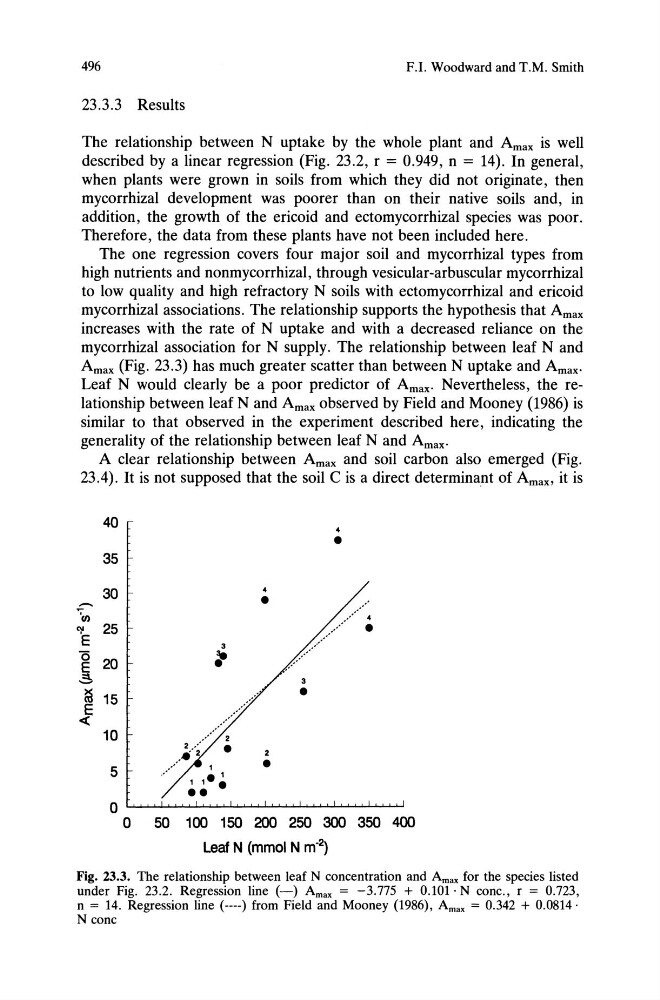
mycorrhizal association for N supply. The relationship between leaf Nand
Amax (Fig. 23.3) has much greater scatter than between N uptake and Amax.
Leaf N would clearly be a poor predictor of Amax. Nevertheless, the relationship between leaf Nand Amax observed by Field and Mooney (1986) is
similar to that observed in the experiment described here, indicating the
generality of the relationship between leaf Nand Amax.
A clear relationship between Amax and soil carbon also emerged (Fig.
23.4). It is not supposed that the soil C is a direct determinant of Amax, it is
40
4
•
35
30
4
.........
•
"7(1)
.' 4
'l'
25
•
E
. ' ...
3
(5 20
~
.'
E
,.=,
3
~ 15
•
.'
E
«
10
.' 2
2.,'
•
. .e 2
2
5
1
•
1 1.~
••
o ~~~~~~~~~~~~~~
o 50 100 150 200 250 300 350 400
Leaf N (mmol N m- 2 )
Fig. 23.3. The relationship between leaf N concentration and Amax for the species listed
under Fig. 23.2. Regression line (-) Amax = -3.775 + O.lDl· N conc., r = 0.723,
n = 14. Regression line (----) from Field and Mooney (1986), Amax = 0.342 + 0.0814·
N conc
F.I. Woodward and T.M. Smith
23.3.3 Results
The relationship between N uptake by the whole plant and Amax is well
described by a linear regression (Fig. 23.2, r = 0.949, n = 14). In general,
when plants were grown in soils from which they did not originate, then
mycorrhizal development was poorer than on their native soils and, in
addition, the growth of the ericoid and ectomycorrhizal species was poor.
Therefore, the data from these plants have not been included here.
The one regression covers four major soil and mycorrhizal types from
high nutrients and nonmycorrhizal, through vesicular-arbuscular mycorrhizal
to low quality and high refractory N soils with ectomycorrhizal and ericoid
mycorrhizal associations. The relationship supports the hypothesis that Amax
increases with the rate of N uptake and with a decreased reliance on the
mycorrhizal association for N supply. The relationship between leaf Nand
Amax (Fig. 23.3) has much greater scatter than between N uptake and Amax.
Leaf N would clearly be a poor predictor of Amax. Nevertheless, the relationship between leaf Nand Amax observed by Field and Mooney (1986) is
similar to that observed in the experiment described here, indicating the
generality of the relationship between leaf Nand Amax.
A clear relationship between Amax and soil carbon also emerged (Fig.
23.4). It is not supposed that the soil C is a direct determinant of Amax, it is
40
4
•
35
30
4
.........
•
"7(1)
.' 4
'l'
25
•
E
. ' ...
3
(5 20
~
.'
E
,.=,
3
~ 15
•
.'
E
«
10
.' 2
2.,'
•
. .e 2
2
5
1
•
1 1.~
••
o ~~~~~~~~~~~~~~
o 50 100 150 200 250 300 350 400
Leaf N (mmol N m- 2 )
Fig. 23.3. The relationship between leaf N concentration and Amax for the species listed
under Fig. 23.2. Regression line (-) Amax = -3.775 + O.lDl· N conc., r = 0.723,
n = 14. Regression line (----) from Field and Mooney (1986), Amax = 0.342 + 0.0814·
N conc