

Predictions and Measurements of the Maximum Photosynthetic Rate
497
50
40
~
';"00
'1'
30
E
(5
E
•
.5
~ 20
• •
E
•
«
10 •
• •
•
• • •
•
•
•
•
0
0
10000
20000
30000
40000
Soil C (9 m- 2 )
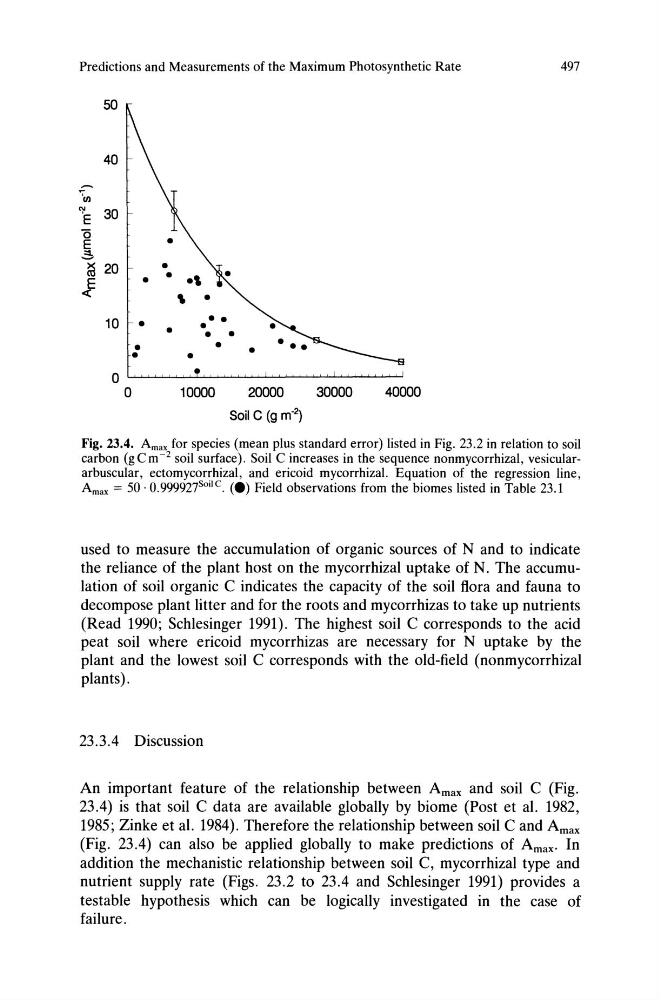
Fig. 23.4. Amax for species (mean plus standard error) listed in Fig. 23.2 in relation to soil
carbon (gCm- 2 soil surface). Soil C increases in the sequence nonmycorrhizal, vesiculararbuscular, ectomycorrhizal, and ericoid mycorrhizal. Equation of the regression line,
Amax == 50· 0.999927SoiIC. (e) Field observations from the biomes listed in Table 23.1
used to measure the accumulation of organic sources of N and to indicate
the reliance of the plant host on the mycorrhizal uptake of N. The accumulation of soil organic C indicates the capacity of the soil flora and fauna to
decompose plant litter and for the roots and mycorrhizas to take up nutrients
(Read 1990; Schlesinger 1991). The highest soil C corresponds to the acid
peat soil where ericoid mycorrhizas are necessary for N uptake by the
plant and the lowest soil C corresponds with the old-field (nonmycorrhizal
plants).
23.3.4 Discussion
An important feature of the relationship between Amax and soil C (Fig.
23.4) is that soil C data are available globally by biome (Post et al. 1982,
1985; Zinke et al. 1984). Therefore the relationship between soil C and Amax
(Fig. 23.4) can also be applied globally to make predictions of Amax. In
addition the mechanistic relationship between soil C, mycorrhizal type and
nutrient supply rate (Figs. 23.2 to 23.4 and Schlesinger 1991) provides a
testable hypothesis which can be logically investigated in the case of
failure.
497
50
40
~
';"00
'1'
30
E
(5
E
•
.5
~ 20
• •
E
•
«
10 •
• •
•
• • •
•
•
•
•
0
0
10000
20000
30000
40000
Soil C (9 m- 2 )
Fig. 23.4. Amax for species (mean plus standard error) listed in Fig. 23.2 in relation to soil
carbon (gCm- 2 soil surface). Soil C increases in the sequence nonmycorrhizal, vesiculararbuscular, ectomycorrhizal, and ericoid mycorrhizal. Equation of the regression line,
Amax == 50· 0.999927SoiIC. (e) Field observations from the biomes listed in Table 23.1
used to measure the accumulation of organic sources of N and to indicate
the reliance of the plant host on the mycorrhizal uptake of N. The accumulation of soil organic C indicates the capacity of the soil flora and fauna to
decompose plant litter and for the roots and mycorrhizas to take up nutrients
(Read 1990; Schlesinger 1991). The highest soil C corresponds to the acid
peat soil where ericoid mycorrhizas are necessary for N uptake by the
plant and the lowest soil C corresponds with the old-field (nonmycorrhizal
plants).
23.3.4 Discussion
An important feature of the relationship between Amax and soil C (Fig.
23.4) is that soil C data are available globally by biome (Post et al. 1982,
1985; Zinke et al. 1984). Therefore the relationship between soil C and Amax
(Fig. 23.4) can also be applied globally to make predictions of Amax. In
addition the mechanistic relationship between soil C, mycorrhizal type and
nutrient supply rate (Figs. 23.2 to 23.4 and Schlesinger 1991) provides a
testable hypothesis which can be logically investigated in the case of
failure.