

~.
'E
'0
E
3
.,
;;
..
~
C ,. .,
0
(;
~
<>
;;
Z
a
476
Ch. Komer
potential or accumulative values of predawn water potentials over a certain
number of days have often been found to correlate with the highest g
reached during a day (e.g., Hinckley et al. 1978; Schulze et al. 1980;
Graham and Running 1984; Ullmann 1985; Davis and Mooney 1986; Grieu
et al. 1988). Rhizosphere moisture content may also affect gpO! either directly by a hydraulic signal or via a hormonal signal (e.g., Turner et al. 1985;
Gollan et al. 1986; Schulze 1986; Wartinger et al. 1990; Bennett 1990).
However, response functions are available for only Jew plant species, not
permitting a parametrization on a global scale. Several researchers have
studied the control of gpO! during the cold season (e.g., Fahey 1979; Smith et
al. 1984; Graham and Running 1984; DeLucia and Smith 1987; Carter et al.
1988; Korner and Perterer 1988; Day et al. 1989; Haellgren et al. 1990), and
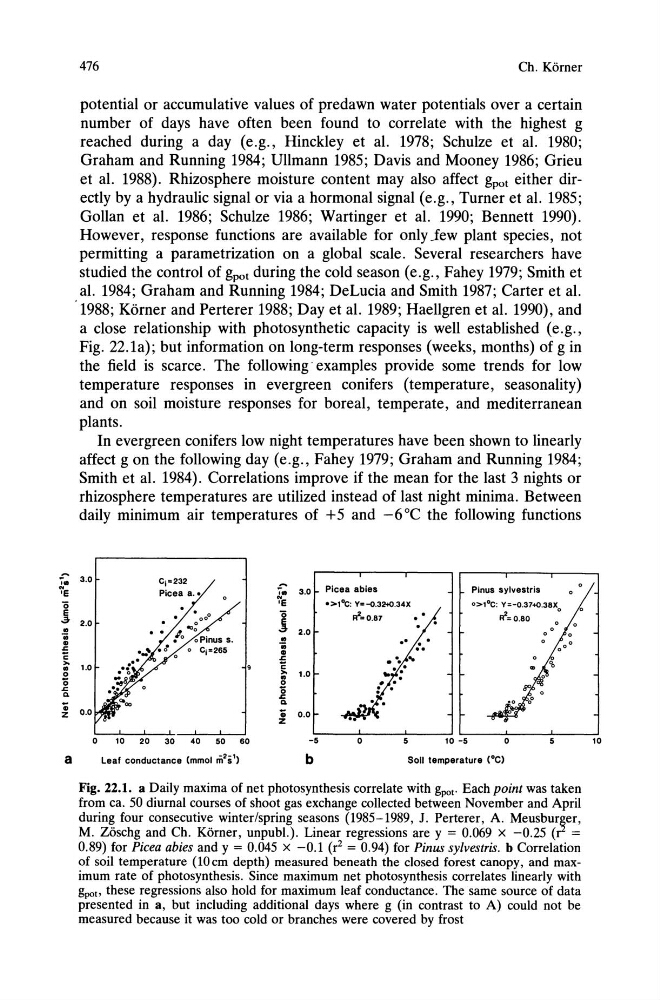
a close relationship with photosynthetic capacity is well established (e.g.,
Fig. 22.1a); but information on long-term responses (weeks, months) of gin
the field is scarce. The following' examples provide some trends for low
temperature responses in evergreen conifers (temperature, seasonality)
and on soil moisture responses for boreal, temperate, and mediterranean
plants.
In evergreen conifers low night temperatures have been shown to linearly
affect g on the following day (e.g., Fahey 1979; Graham and Running 1984;
Smith et al. 1984). Correlations improve if the mean for the last 3 nights or
rhizosphere temperatures are utilized instead of last night minima. Between
daily minimum air temperatures of +5 and -6°C the following functions
3.0
Cj=232
-
~. 3.0 Picea abies
Pinus sylvestris
'E
.>I"c: y=-o.32
'0
11'=0.87
11'= 0.80
E
0
0
3 2.0
0
0
.,
.. .
;;
.
0
..
0 0
II
~
. . . .
c
.
..
.. 1.0
.. .
.,
0
t
..
(;
.
~
<>
;; 0.0
Z
0
10
20
30
40
50
60
-5
0
10 -5
0
Leal conductance (mmol Iii"s')
b
Soli temperature (OC)
Fig. 22.1. a Daily maxima of net photosynthesis correlate with gpot. Each point was taken
from ca. 50 diurnal courses of shoot gas exchange collected between November and April
during four consecutive winter/spring seasons (1985-1989, J. Perterer, A. Meusburger,
M. ZOschg and Ch. Komer, unpub!.). Linear regressions are y = 0.069 x -0.25 (r =
0.89) for Picea abies and y = 0.045 x -0.1 (r2 = 0.94) for Pinus sylvestris. b Correlation
of soil temperature (lOcm depth) measured beneath the closed forest canopy, and maximum rate of photosynthesis. Since maximum net photosynthesis correlates linearly with
gpot, these regressions also hold for maximum leaf conductance. The same source of data
presented in a, but including additional days where g (in contrast to A) could not be
measured because it was too cold or branches were covered by frost
10
'E
'0
E
3
.,
;;
..
~
C ,. .,
0
(;
~
<>
;;
Z
a
476
Ch. Komer
potential or accumulative values of predawn water potentials over a certain
number of days have often been found to correlate with the highest g
reached during a day (e.g., Hinckley et al. 1978; Schulze et al. 1980;
Graham and Running 1984; Ullmann 1985; Davis and Mooney 1986; Grieu
et al. 1988). Rhizosphere moisture content may also affect gpO! either directly by a hydraulic signal or via a hormonal signal (e.g., Turner et al. 1985;
Gollan et al. 1986; Schulze 1986; Wartinger et al. 1990; Bennett 1990).
However, response functions are available for only Jew plant species, not
permitting a parametrization on a global scale. Several researchers have
studied the control of gpO! during the cold season (e.g., Fahey 1979; Smith et
al. 1984; Graham and Running 1984; DeLucia and Smith 1987; Carter et al.
1988; Korner and Perterer 1988; Day et al. 1989; Haellgren et al. 1990), and
a close relationship with photosynthetic capacity is well established (e.g.,
Fig. 22.1a); but information on long-term responses (weeks, months) of gin
the field is scarce. The following' examples provide some trends for low
temperature responses in evergreen conifers (temperature, seasonality)
and on soil moisture responses for boreal, temperate, and mediterranean
plants.
In evergreen conifers low night temperatures have been shown to linearly
affect g on the following day (e.g., Fahey 1979; Graham and Running 1984;
Smith et al. 1984). Correlations improve if the mean for the last 3 nights or
rhizosphere temperatures are utilized instead of last night minima. Between
daily minimum air temperatures of +5 and -6°C the following functions
3.0
Cj=232
-
~. 3.0 Picea abies
Pinus sylvestris
'E
.>I"c: y=-o.32
'0
11'=0.87
11'= 0.80
E
0
0
3 2.0
0
0
.,
.. .
;;
.
0
..
0 0
II
~
. . . .
c
.
..
.. 1.0
.. .
.,
0
t
..
(;
.
~
<>
;; 0.0
Z
0
10
20
30
40
50
60
-5
0
10 -5
0
Leal conductance (mmol Iii"s')
b
Soli temperature (OC)
Fig. 22.1. a Daily maxima of net photosynthesis correlate with gpot. Each point was taken
from ca. 50 diurnal courses of shoot gas exchange collected between November and April
during four consecutive winter/spring seasons (1985-1989, J. Perterer, A. Meusburger,
M. ZOschg and Ch. Komer, unpub!.). Linear regressions are y = 0.069 x -0.25 (r =
0.89) for Picea abies and y = 0.045 x -0.1 (r2 = 0.94) for Pinus sylvestris. b Correlation
of soil temperature (lOcm depth) measured beneath the closed forest canopy, and maximum rate of photosynthesis. Since maximum net photosynthesis correlates linearly with
gpot, these regressions also hold for maximum leaf conductance. The same source of data
presented in a, but including additional days where g (in contrast to A) could not be
measured because it was too cold or branches were covered by frost
10