

472
Ch. Komer
trees of the temperate zone. Several re-assessments of the available data did
not change this picture.
Means are well supported by individual data for tundra, boreal coniferous
forests, temperate deciduous forests and mediterranean vegetation. Thanks
to some v~ry intensive studies in S. America, Africa, and Australia, a
good data set for trees and shrubs from semi-arid shrub- and woodlands is
available. A fair number of values is available for humid tropical evergreen
forests, but given the diversity and geographic extent of this type of vegetation the mean presented here still seems to be weakly founded. Evidently
"THE" humid tropical rainforest does not exist, and many readers may miss
a finer distinction, but neither were such finer categories supported by
sufficient data, nor did the ones that were available indicate any difference,
e.g., between mountain and lowland tropical forests. Completely insufficient
information is available for dry natural grasslands, both in the continental
temperate zone and the subtropics and tropics. Research with grasses from
these regions, with very few exemptions, was done in nurseries or greenhouses irrelevant for the present purpose. Many types of vegetation have
not been studied at all, but their areal extent may be relatively small and
categories presented here may serve as first approximation values for these
missing categories.
In conclusion, the numbers for gmax available at this time do not provide
a justification to apply different gmax for the major biomes of the globe that
are dominated by woody plants. The global mean for the most important
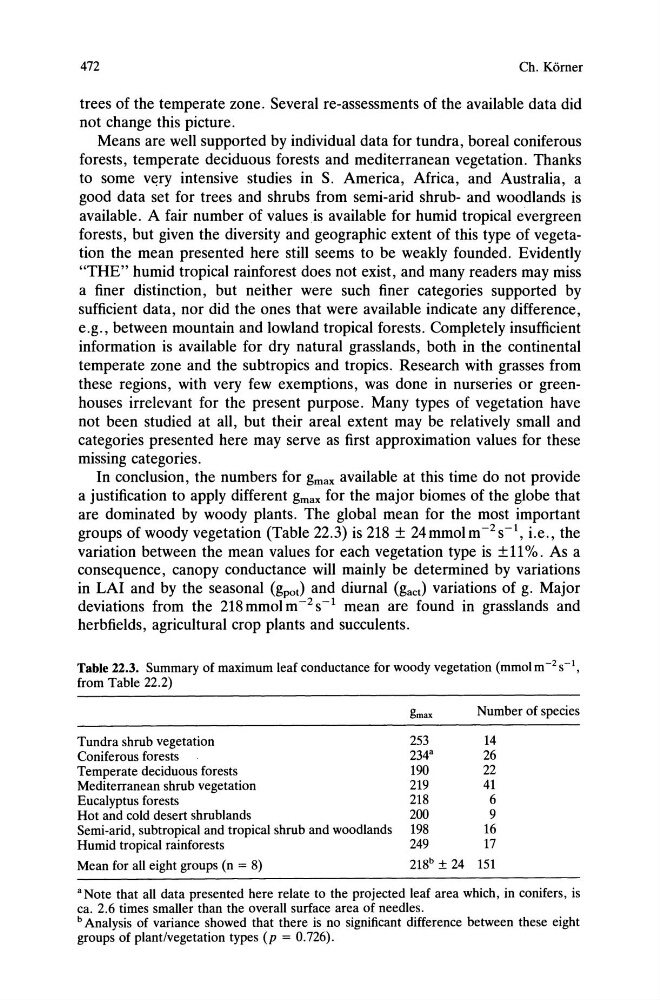
groups of woody vegetation (Table 22.3) is 218 ± 24mmolm- 2 s-1, i.e., the
variation between the mean values for each vegetation type is ± 11 %. As a
consequence, canopy conductance will mainly be determined by variations
in LAI and by the seasonal (gpot) and diurnal (gaet) variations of g. Major
deviations from the 218mmolm- 2 s- 1 mean are found in grasslands and
herbfields, agricultural crop plants and succulents.
Table 22.3. Summary of maximum leaf conductance for woody vegetation (mmolm- 2 s- 1 ,
from Table 22.2)
Tundra shrub vegetation
Coniferous forests
Temperate deciduous forests
Mediterranean shrub vegetation
Eucalyptus forests
Hot and cold desert shrublands
Semi-arid, subtropical and tropical shrub and woodlands
Humid tropical rainforests
Mean for all eight groups (n = 8)
gm,x
Number of species
253
14
234'
26
190
22
219
41
218
6
200
9
198
16
249
17
218 b ± 24 151
'Note that all data presented here relate to the projected leaf area which, in conifers, is
ca. 2.6 times smaller than the overall surface area of needles.
b Analysis of variance showed that there is no significant difference between these eight
groups of plant/vegetation types (p = 0.726).
Ch. Komer
trees of the temperate zone. Several re-assessments of the available data did
not change this picture.
Means are well supported by individual data for tundra, boreal coniferous
forests, temperate deciduous forests and mediterranean vegetation. Thanks
to some v~ry intensive studies in S. America, Africa, and Australia, a
good data set for trees and shrubs from semi-arid shrub- and woodlands is
available. A fair number of values is available for humid tropical evergreen
forests, but given the diversity and geographic extent of this type of vegetation the mean presented here still seems to be weakly founded. Evidently
"THE" humid tropical rainforest does not exist, and many readers may miss
a finer distinction, but neither were such finer categories supported by
sufficient data, nor did the ones that were available indicate any difference,
e.g., between mountain and lowland tropical forests. Completely insufficient
information is available for dry natural grasslands, both in the continental
temperate zone and the subtropics and tropics. Research with grasses from
these regions, with very few exemptions, was done in nurseries or greenhouses irrelevant for the present purpose. Many types of vegetation have
not been studied at all, but their areal extent may be relatively small and
categories presented here may serve as first approximation values for these
missing categories.
In conclusion, the numbers for gmax available at this time do not provide
a justification to apply different gmax for the major biomes of the globe that
are dominated by woody plants. The global mean for the most important
groups of woody vegetation (Table 22.3) is 218 ± 24mmolm- 2 s-1, i.e., the
variation between the mean values for each vegetation type is ± 11 %. As a
consequence, canopy conductance will mainly be determined by variations
in LAI and by the seasonal (gpot) and diurnal (gaet) variations of g. Major
deviations from the 218mmolm- 2 s- 1 mean are found in grasslands and
herbfields, agricultural crop plants and succulents.
Table 22.3. Summary of maximum leaf conductance for woody vegetation (mmolm- 2 s- 1 ,
from Table 22.2)
Tundra shrub vegetation
Coniferous forests
Temperate deciduous forests
Mediterranean shrub vegetation
Eucalyptus forests
Hot and cold desert shrublands
Semi-arid, subtropical and tropical shrub and woodlands
Humid tropical rainforests
Mean for all eight groups (n = 8)
gm,x
Number of species
253
14
234'
26
190
22
219
41
218
6
200
9
198
16
249
17
218 b ± 24 151
'Note that all data presented here relate to the projected leaf area which, in conifers, is
ca. 2.6 times smaller than the overall surface area of needles.
b Analysis of variance showed that there is no significant difference between these eight
groups of plant/vegetation types (p = 0.726).