

Leaf Diffusive Conductances in the Major Vegetation Types of the Globe
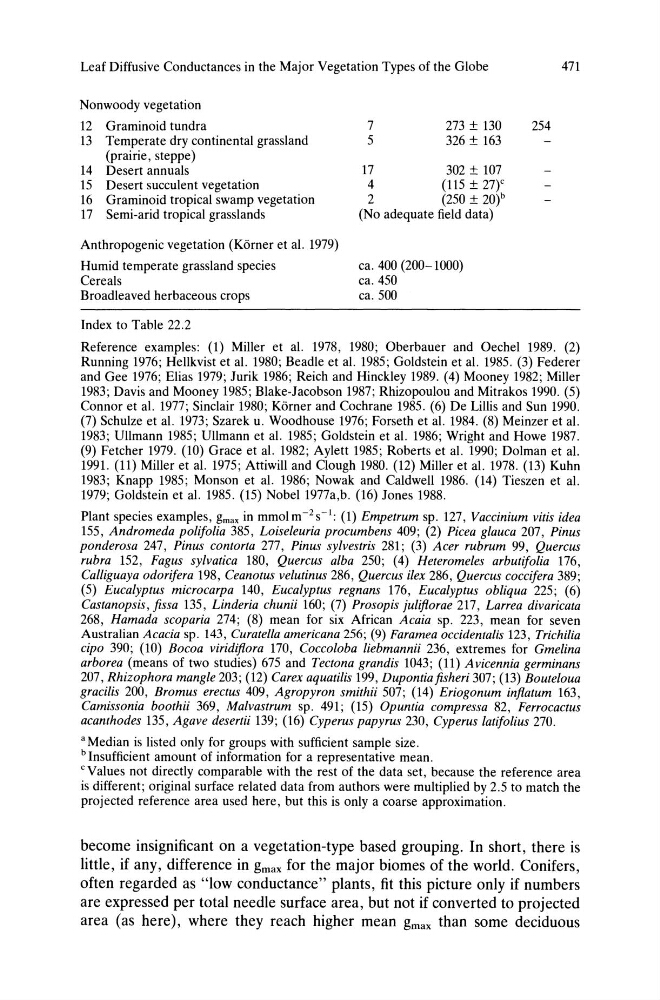
Nonwoody vegetation
12 Graminoid tundra
13 Temperate dry continental grassland
(prairie, steppe)
14 Desert annuals
15 Desert succulent vegetation
16 Graminoid tropical swamp vegetation
17 Semi-arid tropical grasslands
Anthropogenic vegetation (Korner et al. 1979)
Humid temperate grassland species
Cereals
Broadleaved herbaceous crops
Index to Table 22.2
7
5
273 ± 130
326 ± 163
17
302 ± 107
4
(115 ± 27)C
2
(250 ± 20)b
(No adequate field data)
ca. 400 (200-1000)
ca. 450
ca. 500
471
254
Reference examples: (1) Miller et al. 1978, 1980; Oberbauer and Oechel 1989. (2)
Running 1976; Hellkvist et al. 1980; Beadle et al. 1985; Goldstein et al. 1985. (3) Federer
and Gee 1976; Elias 1979; Jurik 1986; Reich and Hinckley 1989. (4) Mooney 1982; Miller
1983; Davis and Mooney 1985; Blake-Jacobson 1987; Rhizopoulou and Mitrakos 1990. (5)
Connor et al. 1977; Sinclair 1980; Korner and Cochrane 1985. (6) De Lillis and Sun 1990.
(7) Schulze et al. 1973; Szarek u. Woodhouse 1976; Forseth et al. 1984. (8) Meinzer et al.
1983; Ullmann 1985; Ullmann et al. 1985; Goldstein et al. 1986; Wright and Howe 1987.
(9) Fetcher 1979. (10) Grace et al. 1982; Aylett 1985; Roberts et al. 1990; Dolman et al.
1991. (11) Miller et al. 1975; Attiwill and Clough 1980. (12) Miller et al. 1978. (13) Kuhn
1983; Knapp 1985; Monson et al. 1986; Nowak and Caldwell 1986. (14) Tieszen et al.
1979; Goldstein et al. 1985. (15) Nobel 1977a,b. (16) Jones 1988.
Plant species examples, gmax in mmolm- 2 s- 1 : (1) Empetrum sp. 127, Vaccinium vitis idea
155, Andromeda polifolia 385, Loiseleuria procumbens 409; (2) Picea glauca 207, Pinus
ponderosa 247, Pinus contorta 277, Pinus sylvestris 281; (3) Acer rubrum 99, Quercus
rubra 152, Fagus sylvatica 180, Quercus alba 250; (4) Heteromeles arbutifolia 176,
Calliguaya odorifera 198, Ceanotus velutinus 286, Quercus ilex 286, Quercus coccifera 389;
(5) Eucalyptus microcarpa 140, Eucalyptus regnans 176, Eucalyptus obliqua 225; (6)
Castanopsis, fissa 135, Linderia chunii 160; (7) Prosopis juliflorae 217, Larrea divaricata
268, Hamada scoparia 274; (8) mean for six African Acaia sp. 223, mean for seven
Australian Acacia sp. 143, Curatella americana 256; (9) Faramea occidentalis 123, Trichilia
cipo 390; (10) Bocoa viridiflora 170, Coccoloba liebmannii 236, extremes for Gmelina
arborea (means of two studies) 675 and Tectona grandis 1043; (11) Avicennia germinans
207, Rhizophora mangle 203; (12) Carex aquatilis 199, Dupontia fisheri 307; (13) Bouteloua
gracilis 200, Bromus erectus 409, Agropyron smithii 507; (14) Eriogonum inflatum 163,
Camissonia boothii 369, Malvastrum sp. 491; (15) Opuntia compressa 82, Ferrocactus
acanthodes 135, Agave desertii 139; (16) Cyperus papyrus 230, Cyperus latifolius 270.
a Median is listed only for groups with sufficient sample size.
b Insufficient amount of information for a representative mean.
C Values not directly comparable with the rest of the data set, because the reference area
is different; original surface related data from authors were multiplied by 2.5 to match the
projected reference area used here, but this is only a coarse approximation.
become insignificant on a vegetation-type based grouping. In short, there is
little, if any, difference in gmax for the major biomes of the world. Conifers,
often regarded as "low conductance" plants, fit this picture only if numbers
are expressed per total needle surface area, but not if converted to projected
area (as here), where they reach higher mean gmax than some deciduous
Nonwoody vegetation
12 Graminoid tundra
13 Temperate dry continental grassland
(prairie, steppe)
14 Desert annuals
15 Desert succulent vegetation
16 Graminoid tropical swamp vegetation
17 Semi-arid tropical grasslands
Anthropogenic vegetation (Korner et al. 1979)
Humid temperate grassland species
Cereals
Broadleaved herbaceous crops
Index to Table 22.2
7
5
273 ± 130
326 ± 163
17
302 ± 107
4
(115 ± 27)C
2
(250 ± 20)b
(No adequate field data)
ca. 400 (200-1000)
ca. 450
ca. 500
471
254
Reference examples: (1) Miller et al. 1978, 1980; Oberbauer and Oechel 1989. (2)
Running 1976; Hellkvist et al. 1980; Beadle et al. 1985; Goldstein et al. 1985. (3) Federer
and Gee 1976; Elias 1979; Jurik 1986; Reich and Hinckley 1989. (4) Mooney 1982; Miller
1983; Davis and Mooney 1985; Blake-Jacobson 1987; Rhizopoulou and Mitrakos 1990. (5)
Connor et al. 1977; Sinclair 1980; Korner and Cochrane 1985. (6) De Lillis and Sun 1990.
(7) Schulze et al. 1973; Szarek u. Woodhouse 1976; Forseth et al. 1984. (8) Meinzer et al.
1983; Ullmann 1985; Ullmann et al. 1985; Goldstein et al. 1986; Wright and Howe 1987.
(9) Fetcher 1979. (10) Grace et al. 1982; Aylett 1985; Roberts et al. 1990; Dolman et al.
1991. (11) Miller et al. 1975; Attiwill and Clough 1980. (12) Miller et al. 1978. (13) Kuhn
1983; Knapp 1985; Monson et al. 1986; Nowak and Caldwell 1986. (14) Tieszen et al.
1979; Goldstein et al. 1985. (15) Nobel 1977a,b. (16) Jones 1988.
Plant species examples, gmax in mmolm- 2 s- 1 : (1) Empetrum sp. 127, Vaccinium vitis idea
155, Andromeda polifolia 385, Loiseleuria procumbens 409; (2) Picea glauca 207, Pinus
ponderosa 247, Pinus contorta 277, Pinus sylvestris 281; (3) Acer rubrum 99, Quercus
rubra 152, Fagus sylvatica 180, Quercus alba 250; (4) Heteromeles arbutifolia 176,
Calliguaya odorifera 198, Ceanotus velutinus 286, Quercus ilex 286, Quercus coccifera 389;
(5) Eucalyptus microcarpa 140, Eucalyptus regnans 176, Eucalyptus obliqua 225; (6)
Castanopsis, fissa 135, Linderia chunii 160; (7) Prosopis juliflorae 217, Larrea divaricata
268, Hamada scoparia 274; (8) mean for six African Acaia sp. 223, mean for seven
Australian Acacia sp. 143, Curatella americana 256; (9) Faramea occidentalis 123, Trichilia
cipo 390; (10) Bocoa viridiflora 170, Coccoloba liebmannii 236, extremes for Gmelina
arborea (means of two studies) 675 and Tectona grandis 1043; (11) Avicennia germinans
207, Rhizophora mangle 203; (12) Carex aquatilis 199, Dupontia fisheri 307; (13) Bouteloua
gracilis 200, Bromus erectus 409, Agropyron smithii 507; (14) Eriogonum inflatum 163,
Camissonia boothii 369, Malvastrum sp. 491; (15) Opuntia compressa 82, Ferrocactus
acanthodes 135, Agave desertii 139; (16) Cyperus papyrus 230, Cyperus latifolius 270.
a Median is listed only for groups with sufficient sample size.
b Insufficient amount of information for a representative mean.
C Values not directly comparable with the rest of the data set, because the reference area
is different; original surface related data from authors were multiplied by 2.5 to match the
projected reference area used here, but this is only a coarse approximation.
become insignificant on a vegetation-type based grouping. In short, there is
little, if any, difference in gmax for the major biomes of the world. Conifers,
often regarded as "low conductance" plants, fit this picture only if numbers
are expressed per total needle surface area, but not if converted to projected
area (as here), where they reach higher mean gmax than some deciduous