

Leaf Diffusive Conductances in the Major Vegetation Types of the Globe
22.6 Maximum Leaf Diffusive Conductance and Maximum Rate
of Leaf Photosynthesis
473
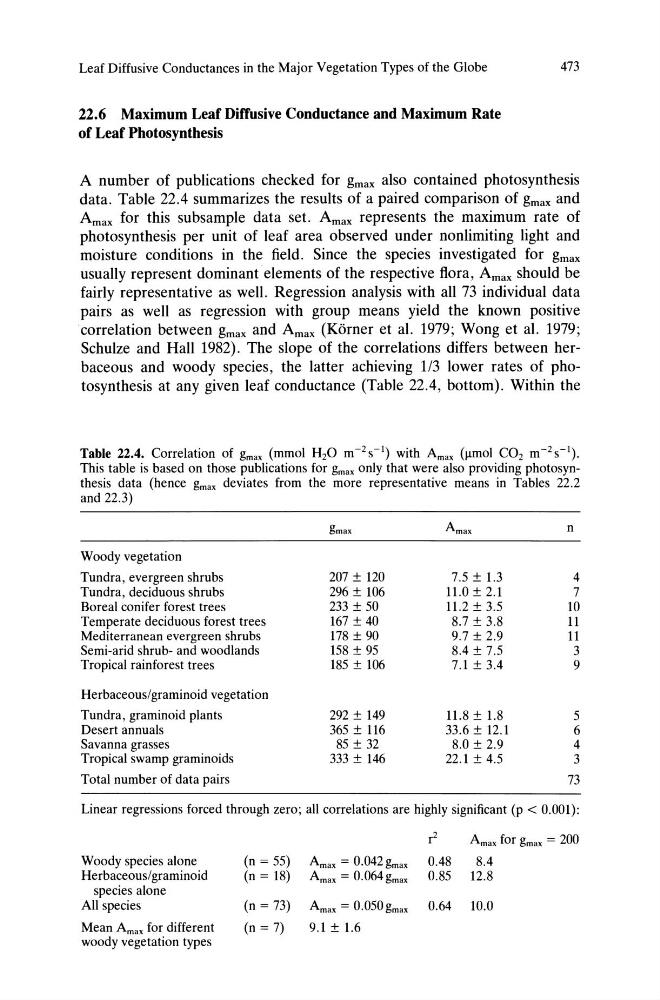
A number of publications checked for gmax also contained photosynthesis
data. Table 22.4 summarizes the results of a paired comparison of gmax and
Amax for this subsample data set. Amax represents the maximum rate of
photosynthesis per unit of leaf area observed under nonlimiting light and
moisture conditions in the field. Since the species investigated for gmax
usually represent dominant elements of the respective flora, Amax should be
fairly representative as well. Regression analysis with all 73 individual data
pairs as well as regression with group means yield the known positive
correlation between gmax and Amax (Korner et al. 1979; Wong et al. 1979;
Schulze and Hall 1982). The slope of the correlations differs between herbaceous and woody species, the latter achieving 113 lower rates of photosynthesis at any given leaf conductance (Table 22.4, bottom). Within the
Table 22.4. Correlation of gmax (mmol H20 m~2s~1) with Amax (~mol CO 2 m~2s~1).
This table is based on those publications for gmax only that were also providing photosynthesis data (hence gmax deviates from the more representative means in Tables 22.2
and 22.3)
gmax
Amax
n
Woody vegetation
Tundra, evergreen shrubs
207 ± 120
7.5 ± 1.3
4
Tundra, deciduous shrubs
296 ± 106
11.0 ± 2.1
7
Boreal conifer forest trees
233 ± 50
11.2 ± 3.5
10
Temperate deciduous forest trees
167 ± 40
8.7 ± 3.8
11
Mediterranean evergreen shrubs
178 ± 90
9.7 ± 2.9
11
Semi-arid shrub- and woodlands
158 ± 95
8.4 ± 7.5
3
Tropical rainforest trees
185 ± 106
7.1±3.4
9
Herbaceous/graminoid vegetation
Tundra, graminoid plants
292 ± 149
11.8 ± 1.8
5
Desert annuals
365 ± 116
33.6 ± 12.1
6
Savanna grasses
85 ± 32
8.0 ± 2.9
4
Tropical swamp graminoids
333 ± 146
22.1 ± 4.5
3
Total number of data pairs
73
Linear regressions forced through zero; all correlations are highly significant (p < 0.001):
r
Amax for gmax = 200
Woody species alone
(n = 55)
Amax = 0.042 gmax
0.48
8.4
Herbaceous/ graminoid
(n = 18) Amax = 0.064 gmax
0.85
12.8
species alone
All species
(n = 73)
Amax = 0.050 gmax
0.64 10.0
Mean Amax for different
(n = 7)
9.1 ± 1.6
woody vegetation types
22.6 Maximum Leaf Diffusive Conductance and Maximum Rate
of Leaf Photosynthesis
473
A number of publications checked for gmax also contained photosynthesis
data. Table 22.4 summarizes the results of a paired comparison of gmax and
Amax for this subsample data set. Amax represents the maximum rate of
photosynthesis per unit of leaf area observed under nonlimiting light and
moisture conditions in the field. Since the species investigated for gmax
usually represent dominant elements of the respective flora, Amax should be
fairly representative as well. Regression analysis with all 73 individual data
pairs as well as regression with group means yield the known positive
correlation between gmax and Amax (Korner et al. 1979; Wong et al. 1979;
Schulze and Hall 1982). The slope of the correlations differs between herbaceous and woody species, the latter achieving 113 lower rates of photosynthesis at any given leaf conductance (Table 22.4, bottom). Within the
Table 22.4. Correlation of gmax (mmol H20 m~2s~1) with Amax (~mol CO 2 m~2s~1).
This table is based on those publications for gmax only that were also providing photosynthesis data (hence gmax deviates from the more representative means in Tables 22.2
and 22.3)
gmax
Amax
n
Woody vegetation
Tundra, evergreen shrubs
207 ± 120
7.5 ± 1.3
4
Tundra, deciduous shrubs
296 ± 106
11.0 ± 2.1
7
Boreal conifer forest trees
233 ± 50
11.2 ± 3.5
10
Temperate deciduous forest trees
167 ± 40
8.7 ± 3.8
11
Mediterranean evergreen shrubs
178 ± 90
9.7 ± 2.9
11
Semi-arid shrub- and woodlands
158 ± 95
8.4 ± 7.5
3
Tropical rainforest trees
185 ± 106
7.1±3.4
9
Herbaceous/graminoid vegetation
Tundra, graminoid plants
292 ± 149
11.8 ± 1.8
5
Desert annuals
365 ± 116
33.6 ± 12.1
6
Savanna grasses
85 ± 32
8.0 ± 2.9
4
Tropical swamp graminoids
333 ± 146
22.1 ± 4.5
3
Total number of data pairs
73
Linear regressions forced through zero; all correlations are highly significant (p < 0.001):
r
Amax for gmax = 200
Woody species alone
(n = 55)
Amax = 0.042 gmax
0.48
8.4
Herbaceous/ graminoid
(n = 18) Amax = 0.064 gmax
0.85
12.8
species alone
All species
(n = 73)
Amax = 0.050 gmax
0.64 10.0
Mean Amax for different
(n = 7)
9.1 ± 1.6
woody vegetation types