

452
J.D. Tenhunen et al.
Table 21.3. Parameter values for the initial slope of the curve (s) relating diurnal CO 2
uptake to integrated irradiance and for maximum potential uptake rate of the community
(Umax) for three community types distributed along the topographic and water availability
gradient occurring within the Imnavait Creek watershed. Parameters are given for the
average response at five times during the season, thus eliminating variation due to
aboveground temperature and moss water content
Dry shrub tundra
Tussock tundra
Riparian meadow
Slope crest
Mid-slope
Lower slope
Umax
Umax
s
Umax
June 15
6.3
106
4.5
104
1.4
41
July 1
14
182
7.0
136
12.7
218
July 15
18.9
472
9.8
270
20.1
603
August 1
19.0
445
9.6
258
19.9
573
August 15
13.7
160
6.7
134
11.4
195
and moss water content effects on photosynthesis. Both factors appear
relatively unimportant over the range of conditions observed during 1985
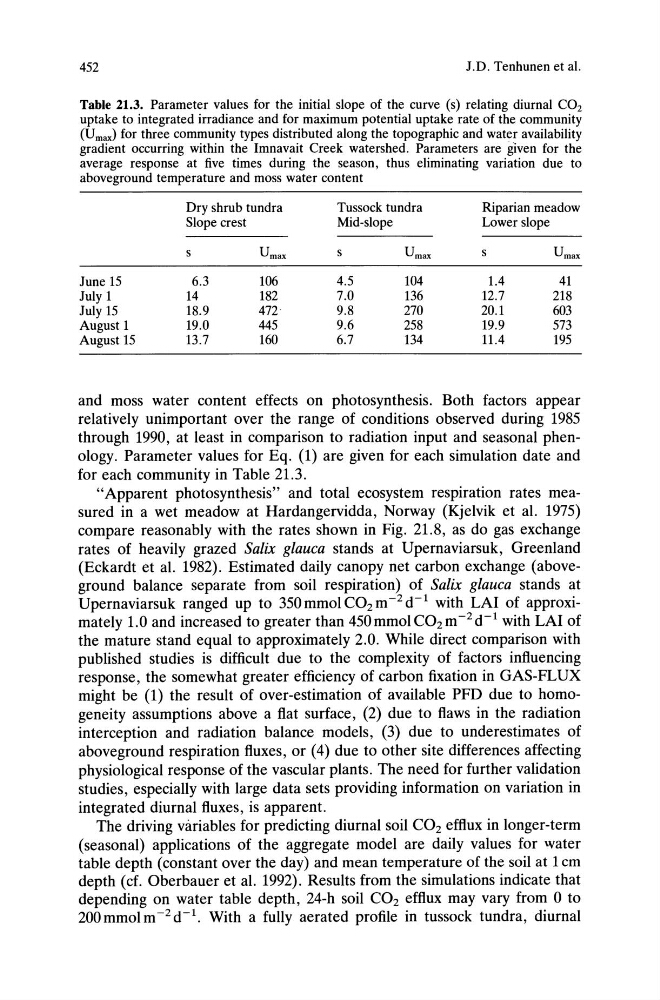
through 1990, at least in comparison to radiation input and seasonal phenology. Parameter values for Eq. (1) are given for each simulation date and
for each community in Table 21.3.
"Apparent photosynthesis" and total ecosystem respiration rates measured in a wet meadow at Hardangervidda, Norway (Kjelvik et al. 1975)
compare reasonably with the rates shown in Fig. 21.8, as do gas exchange
rates of heavily grazed Salix glauca stands at Upernaviarsuk, Greenland
(Eckardt et al. 1982). Estimated daily canopy net carbon exchange (aboveground balance separate from soil respiration) of Salix glauca stands at
Upernaviarsuk ranged up to 350mmoIC0 2 m- 2 d- 1 with LAI of approximately 1.0 and increased to greater than 450mmoIC02 m- 2 d- 1 with LAI of
the mature stand equal to approximately 2.0. While direct comparison with
published studies is difficult due to the complexity of factors influencing
response, the somewhat greater efficiency of carbon fixation in GAS-FLUX
might be (1) the result of over-estimation of available PFD due to homogeneity assumptions above a flat surface, (2) due to flaws in the radiation
interception and radiation balance models, (3) due to underestimates of
aboveground respiration fluxes, or (4) due to other site differences affecting
physiological response of the vascular plants. The need for further validation
studies, especially with large data sets providing information on variation in
integrated diurnal fluxes, is apparent.
The driving variables for predicting diurnal soil CO2 efflux in longer-term
(seasonal) applications of the aggregate model are daily values for water
table depth (constant over the day) and mean temperature of the soil at 1 em
depth (cf. Oberbauer et al. 1992). Results from the simulations indicate that
depending on water table depth, 24-h soil CO2 efflux may vary from 0 to
200 mmol m -2 d -1. With a fully aerated profile in tussock tundra, diurnal
J.D. Tenhunen et al.
Table 21.3. Parameter values for the initial slope of the curve (s) relating diurnal CO 2
uptake to integrated irradiance and for maximum potential uptake rate of the community
(Umax) for three community types distributed along the topographic and water availability
gradient occurring within the Imnavait Creek watershed. Parameters are given for the
average response at five times during the season, thus eliminating variation due to
aboveground temperature and moss water content
Dry shrub tundra
Tussock tundra
Riparian meadow
Slope crest
Mid-slope
Lower slope
Umax
Umax
s
Umax
June 15
6.3
106
4.5
104
1.4
41
July 1
14
182
7.0
136
12.7
218
July 15
18.9
472
9.8
270
20.1
603
August 1
19.0
445
9.6
258
19.9
573
August 15
13.7
160
6.7
134
11.4
195
and moss water content effects on photosynthesis. Both factors appear
relatively unimportant over the range of conditions observed during 1985
through 1990, at least in comparison to radiation input and seasonal phenology. Parameter values for Eq. (1) are given for each simulation date and
for each community in Table 21.3.
"Apparent photosynthesis" and total ecosystem respiration rates measured in a wet meadow at Hardangervidda, Norway (Kjelvik et al. 1975)
compare reasonably with the rates shown in Fig. 21.8, as do gas exchange
rates of heavily grazed Salix glauca stands at Upernaviarsuk, Greenland
(Eckardt et al. 1982). Estimated daily canopy net carbon exchange (aboveground balance separate from soil respiration) of Salix glauca stands at
Upernaviarsuk ranged up to 350mmoIC0 2 m- 2 d- 1 with LAI of approximately 1.0 and increased to greater than 450mmoIC02 m- 2 d- 1 with LAI of
the mature stand equal to approximately 2.0. While direct comparison with
published studies is difficult due to the complexity of factors influencing
response, the somewhat greater efficiency of carbon fixation in GAS-FLUX
might be (1) the result of over-estimation of available PFD due to homogeneity assumptions above a flat surface, (2) due to flaws in the radiation
interception and radiation balance models, (3) due to underestimates of
aboveground respiration fluxes, or (4) due to other site differences affecting
physiological response of the vascular plants. The need for further validation
studies, especially with large data sets providing information on variation in
integrated diurnal fluxes, is apparent.
The driving variables for predicting diurnal soil CO2 efflux in longer-term
(seasonal) applications of the aggregate model are daily values for water
table depth (constant over the day) and mean temperature of the soil at 1 em
depth (cf. Oberbauer et al. 1992). Results from the simulations indicate that
depending on water table depth, 24-h soil CO2 efflux may vary from 0 to
200 mmol m -2 d -1. With a fully aerated profile in tussock tundra, diurnal