

400
Dry shrub tundra
0
t
temperature,
Ll
13
b
moss water
~
~
content
~
.
300
200
....
100
,
>CIS
'tJ
~B
i
~
iii
~e
i +
+
,
I
•
I
iii
it t
GI A
A
c:'
0
E
'0
E
E
- 200
Q)
~
Tussock tundra
.~
i
~
.
~
phenology
CIS
- Co
:J
N
100
0
0
'tJ
C
::J
0 ...
0
en Q)
>
0
500
.0
t~ M i
I
iii ~.
t
A r
•
6
, , ,8.
Riparian wet
1f
meadow
El
~
~
~
vegetation
structure and
iii
composition
300
200
100
rAil
i~
iii ~p
~
t~
I!I
.p
Q
A AI A
o
•
I
I
o 10 20 30 40 50 60 70
PFD (mol m- 2 day-1 )
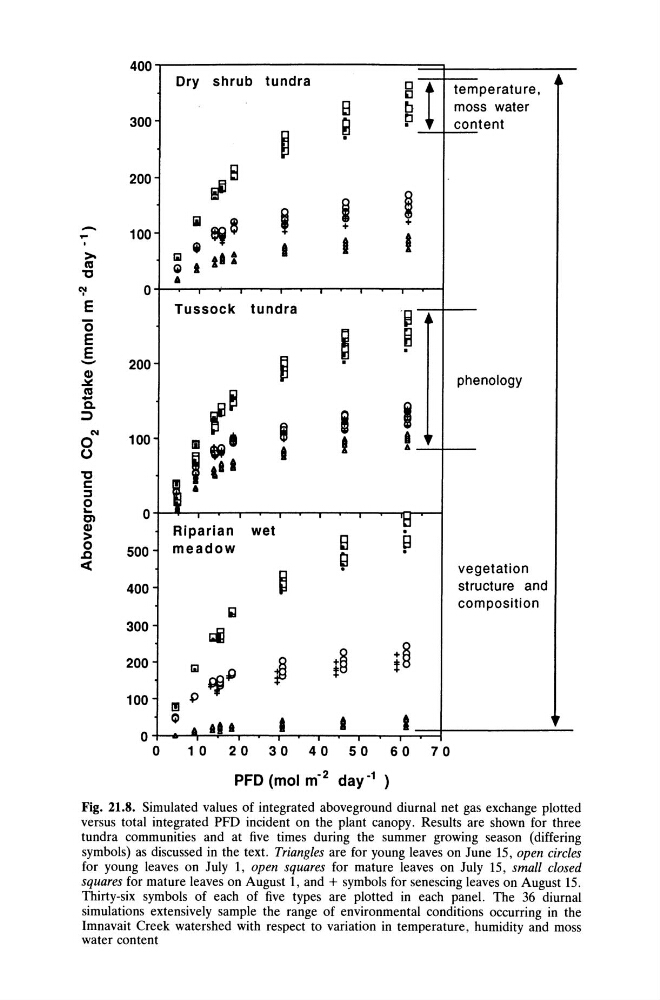
Fig. 21.S. Simulated values of integrated aboveground diurnal net gas exchange plotted
versus total integrated PFD incident on the plant canopy. Results are shown for three
tundra communities and at five times during the summer growing season (differing
symbols) as discussed in the text. Triangles are for young leaves on June 15, open circles
for young leaves on July 1, open squares for mature leaves on July 15, small closed
squares for mature leaves on August 1, and + symbols for senescing leaves on August 15.
Thirty-six symbols of each of five types are plotted in each panel. The 36 diurnal
simulations extensively sample the range of environmental conditions occurring in the
Imnavait Creek watershed with respect to variation in temperature, humidity and moss
water content
Dry shrub tundra
0
t
temperature,
Ll
13
b
moss water
~
~
content
~
.
300
200
....
100
,
>CIS
'tJ
~B
i
~
iii
~e
i +
+
,
I
•
I
iii
it t
GI A
A
c:'
0
E
'0
E
E
- 200
Q)
~
Tussock tundra
.~
i
~
.
~
phenology
CIS
- Co
:J
N
100
0
0
'tJ
C
::J
0 ...
0
en Q)
>
0
500
.0
t~ M i
I
iii ~.
t
A r
•
6
, , ,8.
Riparian wet
1f
meadow
El
~
~
~
vegetation
structure and
iii
composition
300
200
100
rAil
i~
iii ~p
~
t~
I!I
.p
Q
A AI A
o
•
I
I
o 10 20 30 40 50 60 70
PFD (mol m- 2 day-1 )
Fig. 21.S. Simulated values of integrated aboveground diurnal net gas exchange plotted
versus total integrated PFD incident on the plant canopy. Results are shown for three
tundra communities and at five times during the summer growing season (differing
symbols) as discussed in the text. Triangles are for young leaves on June 15, open circles
for young leaves on July 1, open squares for mature leaves on July 15, small closed
squares for mature leaves on August 1, and + symbols for senescing leaves on August 15.
Thirty-six symbols of each of five types are plotted in each panel. The 36 diurnal
simulations extensively sample the range of environmental conditions occurring in the
Imnavait Creek watershed with respect to variation in temperature, humidity and moss
water content