

Effects of Phenology, Physiology, and Gradients in Community Composition
453
-
0> .....
~,
cu>":::cu
:5"'0
N
N'
OE
0o
-E
~E
-
200
Tussock tundra
~
~
~
100
E
Temperature
Increase
t~
8 I
I
o ----------9 ------,- -------6- - - - - - - - e- ---------1iI~
ft
It
A
i ,t A
i A
Water Table
-100
Increase
o 10 20 30 40 50 60 70
PFD (mol m -2day -1)
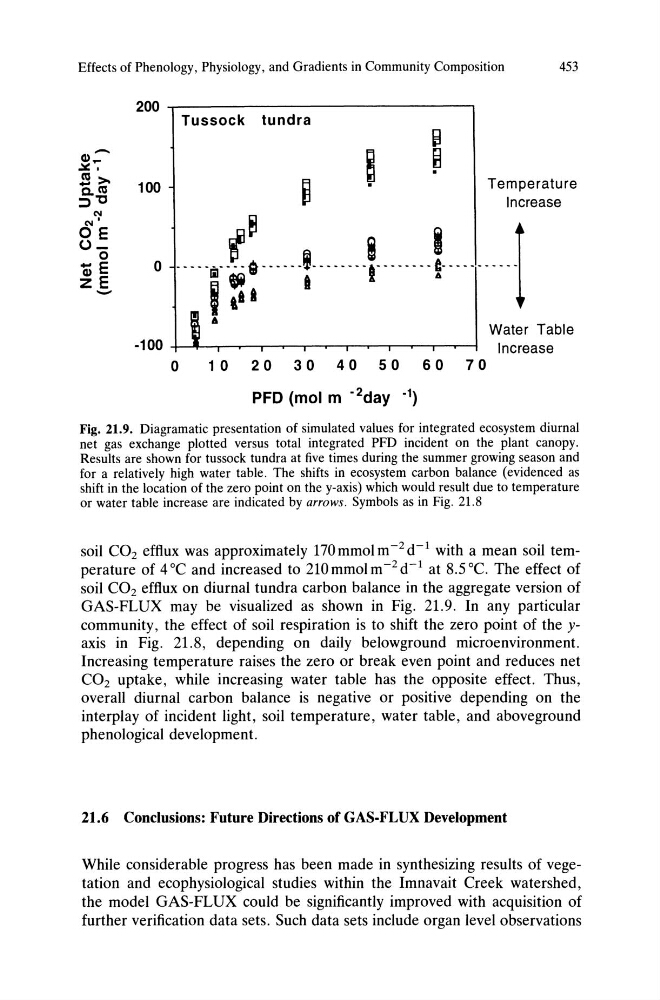
Fig. 21.9. Diagramatic presentation of simulated values for integrated ecosystem diurnal
net gas exchange plotted versus total integrated PFD incident on the plant canopy.
Results are shown for tussock tundra at five times during the summer growing season and
for a relatively high water table. The shifts in ecosystem carbon balance (evidenced as
shift in the location of the zero point on the y-axis) which would result due to temperature
or water table increase are indicated by arrows. Symbols as in Fig. 21.8
soil CO 2 efflux was approximately 170mmolm- 2 d- 1 with a mean soil temperature of 4°C and increased to 21Ommolm- 2 d- 1 at 8.5°C. The effect of
soil CO2 efflux on diurnal tundra carbon balance in the aggregate version of
GAS-FLUX may be visualized as shown in Fig. 21.9. In any particular
community, the effect of soil respiration is to shift the zero point of the yaxis in Fig. 21.8, depending on daily belowground microenvironment.
Increasing temperature raises the zero or break even point and reduces net
CO2 uptake, while increasing water table has the opposite effect. Thus,
overall diurnal carbon balance is negative or positive depending on the
interplay of incident light, soil temperature, water table, and aboveground
phenological development.
21.6 Conclusions: Future Directions of GAS-FLUX Development
While considerable progress has been made in synthesizing results of vegetation and ecophysiological studies within the Imnavait Creek watershed,
the model GAS-FLUX could be significantly improved with acquisition of
further verification data sets. Such data sets include organ level observations
453
-
0> .....
~,
cu>":::cu
:5"'0
N
N'
OE
0o
-E
~E
-
200
Tussock tundra
~
~
~
100
E
Temperature
Increase
t~
8 I
I
o ----------9 ------,- -------6- - - - - - - - e- ---------1iI~
ft
It
A
i ,t A
i A
Water Table
-100
Increase
o 10 20 30 40 50 60 70
PFD (mol m -2day -1)
Fig. 21.9. Diagramatic presentation of simulated values for integrated ecosystem diurnal
net gas exchange plotted versus total integrated PFD incident on the plant canopy.
Results are shown for tussock tundra at five times during the summer growing season and
for a relatively high water table. The shifts in ecosystem carbon balance (evidenced as
shift in the location of the zero point on the y-axis) which would result due to temperature
or water table increase are indicated by arrows. Symbols as in Fig. 21.8
soil CO 2 efflux was approximately 170mmolm- 2 d- 1 with a mean soil temperature of 4°C and increased to 21Ommolm- 2 d- 1 at 8.5°C. The effect of
soil CO2 efflux on diurnal tundra carbon balance in the aggregate version of
GAS-FLUX may be visualized as shown in Fig. 21.9. In any particular
community, the effect of soil respiration is to shift the zero point of the yaxis in Fig. 21.8, depending on daily belowground microenvironment.
Increasing temperature raises the zero or break even point and reduces net
CO2 uptake, while increasing water table has the opposite effect. Thus,
overall diurnal carbon balance is negative or positive depending on the
interplay of incident light, soil temperature, water table, and aboveground
phenological development.
21.6 Conclusions: Future Directions of GAS-FLUX Development
While considerable progress has been made in synthesizing results of vegetation and ecophysiological studies within the Imnavait Creek watershed,
the model GAS-FLUX could be significantly improved with acquisition of
further verification data sets. Such data sets include organ level observations