

22
J.L. Giraudel . S. Lek
2.3
How to Use a Self-Organizing Map with an Abundance
Dataset?
2.3.1
Mapping the Stations
(2.4)
The SOM has been computed in order that the VU distribution should follow the
SU distribution. Most usually, the SOM is used to show SUs in the corresponding
hexagons, SUs are mapped by a nearest neighbor method. For this purpose, the
BMU is computed for each SU and this SU is put in the corresponding hexagon.
The results obtained with the Euclidean distance are given in Fig. 2.4 and those
obtained with the Whittaker's relative transformation are given in Fig. 2.5.
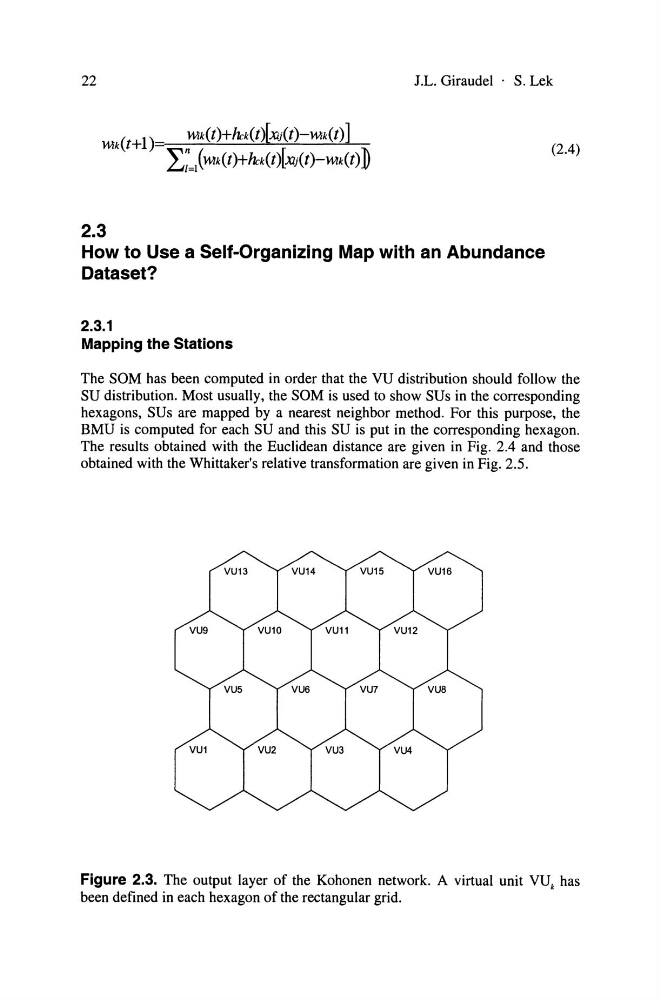
Figure 2.3. The output layer of the Kohonen network. A virtual unit VU k has
been defined in each hexagon of the rectangular grid.
J.L. Giraudel . S. Lek
2.3
How to Use a Self-Organizing Map with an Abundance
Dataset?
2.3.1
Mapping the Stations
(2.4)
The SOM has been computed in order that the VU distribution should follow the
SU distribution. Most usually, the SOM is used to show SUs in the corresponding
hexagons, SUs are mapped by a nearest neighbor method. For this purpose, the
BMU is computed for each SU and this SU is put in the corresponding hexagon.
The results obtained with the Euclidean distance are given in Fig. 2.4 and those
obtained with the Whittaker's relative transformation are given in Fig. 2.5.
Figure 2.3. The output layer of the Kohonen network. A virtual unit VU k has
been defined in each hexagon of the rectangular grid.