

376
S.G. Robertson . A.K. Morison
(Morison et al. 1998a). Secondly, the slope and intercept for a linear regression of
predicted on observed ages was used as a measure of bias, with success being
quantified as no significant differences from 1 and 0 respectively. KolmogorovSmimov tests were used to compare the observed and predicted age compositions
of the production set.
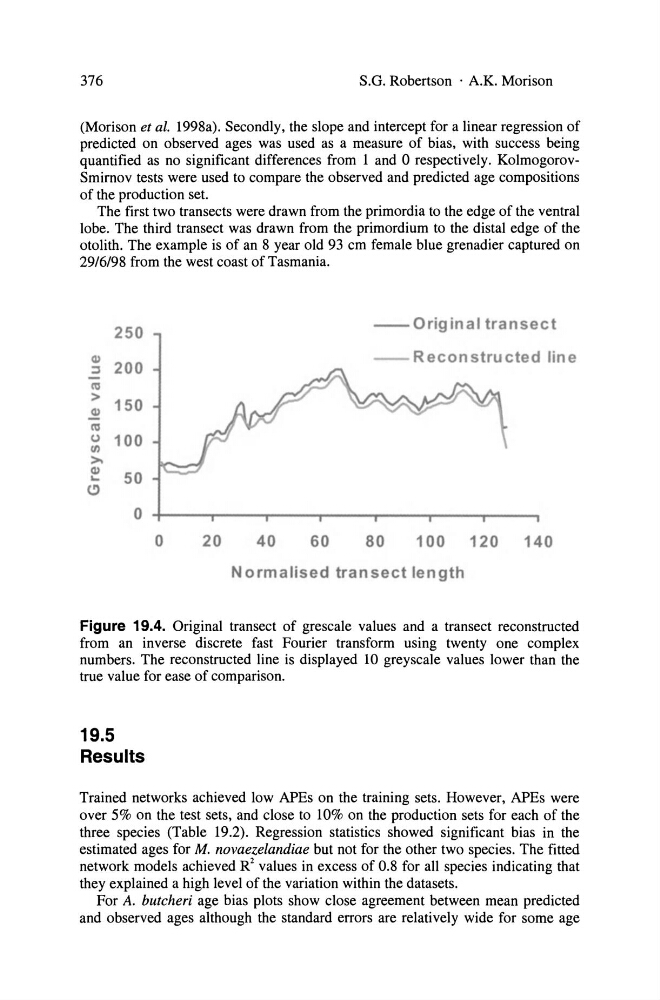
The first two transects were drawn from the primordia to the edge of the ventral
lobe. The third transect was drawn from the primordium to the distal edge of the
otolith. The example is of an 8 year old 93 cm female blue grenadier captured on
29/6/98 from the west coast of Tasmania.
250
--Original transect
CI)
200
::l
- - Reconstructed line
"'
> 150
CI)
ca
(,)
100
In
>CI)
50
...
0
0
20
40
60
80
100 120 140
Normalised transect length
Figure 19.4. Original transect of grescale values and a transect reconstructed
from an inverse discrete fast Fourier transform using twenty one complex
numbers. The reconstructed line is displayed 10 greyscale values lower than the
true value for ease of comparison.
19.5
Results
Trained networks achieved low APEs on the training sets. However, APEs were
over 5% on the test sets, and close to 10% on the production sets for each of the
three species (Table 19.2). Regression statistics showed significant bias in the
estimated ages for M. novaezelandiae but not for the other two species. The fitted
network models achieved R 2 values in excess of 0.8 for all species indicating that
they explained a high level of the variation within the datasets.
For A. butcheri age bias plots show close agreement between mean predicted
and observed ages although the standard errors are relatively wide for some age
S.G. Robertson . A.K. Morison
(Morison et al. 1998a). Secondly, the slope and intercept for a linear regression of
predicted on observed ages was used as a measure of bias, with success being
quantified as no significant differences from 1 and 0 respectively. KolmogorovSmimov tests were used to compare the observed and predicted age compositions
of the production set.
The first two transects were drawn from the primordia to the edge of the ventral
lobe. The third transect was drawn from the primordium to the distal edge of the
otolith. The example is of an 8 year old 93 cm female blue grenadier captured on
29/6/98 from the west coast of Tasmania.
250
--Original transect
CI)
200
::l
- - Reconstructed line
"'
> 150
CI)
ca
(,)
100
In
>CI)
50
...
0
0
20
40
60
80
100 120 140
Normalised transect length
Figure 19.4. Original transect of grescale values and a transect reconstructed
from an inverse discrete fast Fourier transform using twenty one complex
numbers. The reconstructed line is displayed 10 greyscale values lower than the
true value for ease of comparison.
19.5
Results
Trained networks achieved low APEs on the training sets. However, APEs were
over 5% on the test sets, and close to 10% on the production sets for each of the
three species (Table 19.2). Regression statistics showed significant bias in the
estimated ages for M. novaezelandiae but not for the other two species. The fitted
network models achieved R 2 values in excess of 0.8 for all species indicating that
they explained a high level of the variation within the datasets.
For A. butcheri age bias plots show close agreement between mean predicted
and observed ages although the standard errors are relatively wide for some age