

Chapter 19 . Age Estimation of Marine Fish
375
the training sampIes to the neural network and genetic optimisation of the scaling
parameters marked the completion of one generation. The training was continued
until no change in the error term for the test set was observed in 20 generations.
The production set provided an estimate on the final performance of the trained
model, using a dataset not previously used in the training (minimisation) or test
phases of model fitting.
Table 19.1. Summary of input variables used for training neural networks.
Dataset
Biological
Signal
Variables
Otolith weight (g)
Fish length (ern)
Sex
Date of capture
Transect lengths (pixels)*
First 21 harmonics from DFT*
*Data were collected from five transects per individual
for A. butcheri and P. auratus and three per individual
for M. novaezelandiae.
Data type
Continuous
Continuous
Categorical
Continuous
Continuous
Continuous
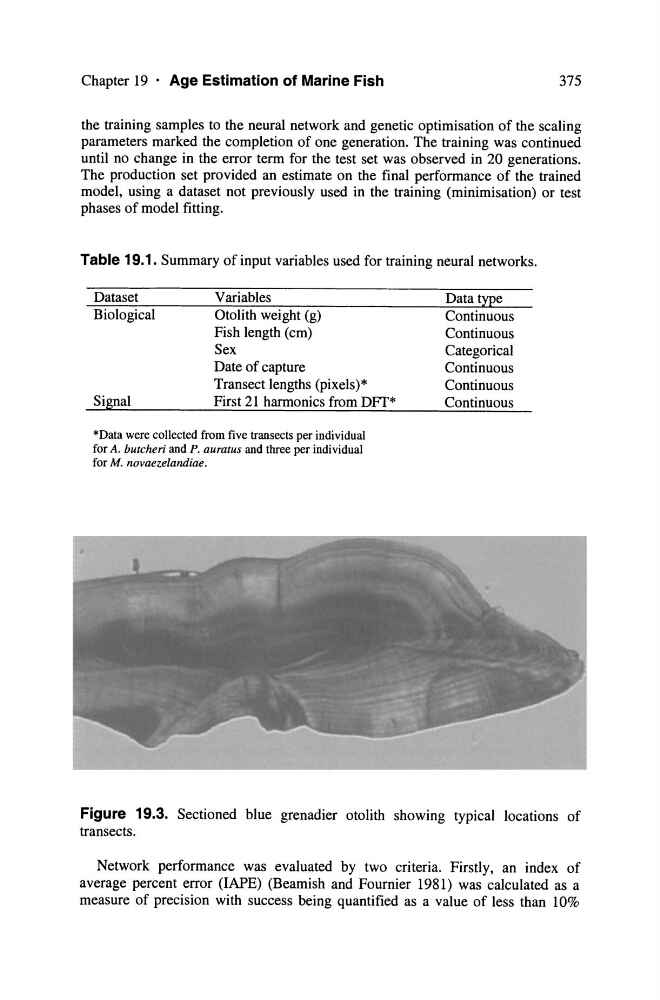
Figure 19.3. Sectioned blue grenadier otolith showing typical locations of
transects.
Network performance was evaluated by two criteria. Firstly, an index of
average percent error (IAPE) (Beamish and Fournier 1981) was calculated as a
measure of precision with success being quantified as a value of less than 10%
375
the training sampIes to the neural network and genetic optimisation of the scaling
parameters marked the completion of one generation. The training was continued
until no change in the error term for the test set was observed in 20 generations.
The production set provided an estimate on the final performance of the trained
model, using a dataset not previously used in the training (minimisation) or test
phases of model fitting.
Table 19.1. Summary of input variables used for training neural networks.
Dataset
Biological
Signal
Variables
Otolith weight (g)
Fish length (ern)
Sex
Date of capture
Transect lengths (pixels)*
First 21 harmonics from DFT*
*Data were collected from five transects per individual
for A. butcheri and P. auratus and three per individual
for M. novaezelandiae.
Data type
Continuous
Continuous
Categorical
Continuous
Continuous
Continuous
Figure 19.3. Sectioned blue grenadier otolith showing typical locations of
transects.
Network performance was evaluated by two criteria. Firstly, an index of
average percent error (IAPE) (Beamish and Fournier 1981) was calculated as a
measure of precision with success being quantified as a value of less than 10%