

Chapter 19 • Age Estimation of Marine Fish
377
cIasses (Figure 19.5). The age composition plots show that the abundance of the
strong year cIasses was underestimated (particularly the 3 and 9 year olds) and
that of the adjacent weaker year cIasses was overestimated. Nevertheless, the
Kolgomorov-Smirnov test found no significant difference between the
distributions. Almost 50% of age estimates that were correct and almost 60% were
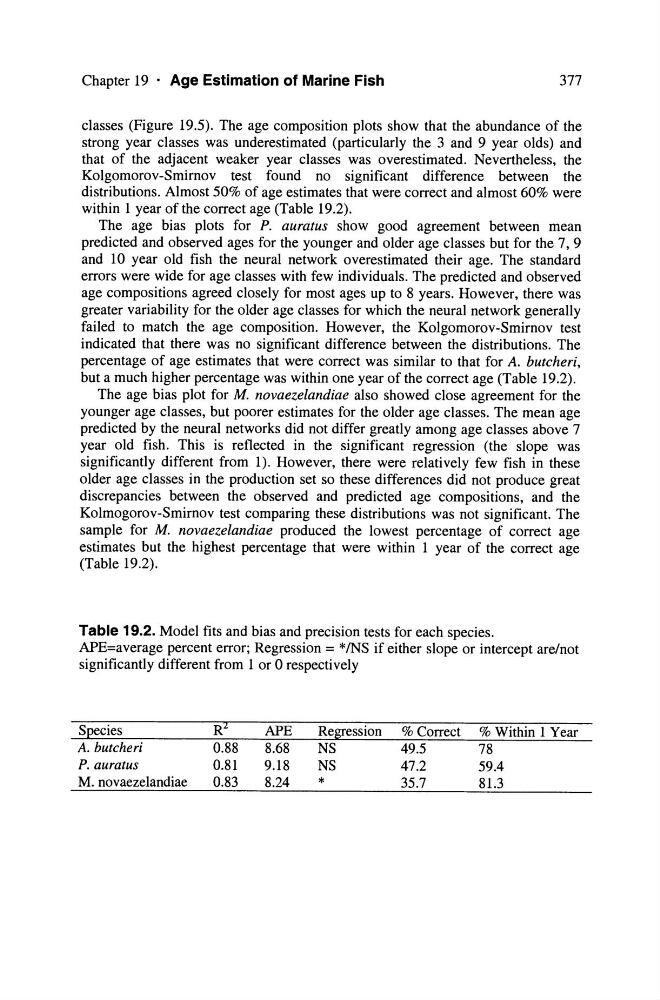
within 1 year of the correct age (Table 19.2).
The age bias plots for P. auratus show good agreement between mean
predicted and observed ages for the younger and older age cIasses but for the 7, 9
and 10 year old fish the neural network overestimated their age. The standard
errors were wide for age cIasses with few individuals. The predicted and observed
age compositions agreed closely for most ages up to 8 years. However, there was
greater variability for the older age cIasses for which the neural network generally
failed to match the age composition. However, the Kolgomorov-Smirnov test
indicated that there was no significant difference between the distributions. The
percentage of age estimates that were correct was similar to that for A. butcheri,
but a much higher percentage was within one year of the correct age (Table 19.2).
The age bias plot for M. novaezelandiae also showed cIose agreement for the
younger age cIasses, but poorer estimates for the older age cIasses. The mean age
predicted by the neural networks did not differ greatly among age cIasses above 7
year old fish. This is reflected in the significant regression (the slope was
significantly different from 1). However, there were relatively few fish in these
older age cIasses in the production set so these differences did not produce great
discrepancies between the observed and predicted age compositions, and the
Kolmogorov-Smirnov test comparing these distributions was not significant. The
sampIe for M. novaezelandiae produced the lowest percentage of correct age
estimates but the highest percentage that were within 1 year of the correct age
(Table 19.2).
Table 19.2. Model fits and bias and precision tests for each species.
APE=average percent error; Regression = */NS if either slope or intercept are/not
significantly different from 1 or 0 respectively
Species
A. butcheri
P. auratus
M. novaezelandiae
0.88
0.81
0.83
APE
8.68
9.18
8.24
Regression
NS
NS
*
% Correct
49.5
47.2
35.7
% Within 1 Year
78
59.4
81.3
377
cIasses (Figure 19.5). The age composition plots show that the abundance of the
strong year cIasses was underestimated (particularly the 3 and 9 year olds) and
that of the adjacent weaker year cIasses was overestimated. Nevertheless, the
Kolgomorov-Smirnov test found no significant difference between the
distributions. Almost 50% of age estimates that were correct and almost 60% were
within 1 year of the correct age (Table 19.2).
The age bias plots for P. auratus show good agreement between mean
predicted and observed ages for the younger and older age cIasses but for the 7, 9
and 10 year old fish the neural network overestimated their age. The standard
errors were wide for age cIasses with few individuals. The predicted and observed
age compositions agreed closely for most ages up to 8 years. However, there was
greater variability for the older age cIasses for which the neural network generally
failed to match the age composition. However, the Kolgomorov-Smirnov test
indicated that there was no significant difference between the distributions. The
percentage of age estimates that were correct was similar to that for A. butcheri,
but a much higher percentage was within one year of the correct age (Table 19.2).
The age bias plot for M. novaezelandiae also showed cIose agreement for the
younger age cIasses, but poorer estimates for the older age cIasses. The mean age
predicted by the neural networks did not differ greatly among age cIasses above 7
year old fish. This is reflected in the significant regression (the slope was
significantly different from 1). However, there were relatively few fish in these
older age cIasses in the production set so these differences did not produce great
discrepancies between the observed and predicted age compositions, and the
Kolmogorov-Smirnov test comparing these distributions was not significant. The
sampIe for M. novaezelandiae produced the lowest percentage of correct age
estimates but the highest percentage that were within 1 year of the correct age
(Table 19.2).
Table 19.2. Model fits and bias and precision tests for each species.
APE=average percent error; Regression = */NS if either slope or intercept are/not
significantly different from 1 or 0 respectively
Species
A. butcheri
P. auratus
M. novaezelandiae
0.88
0.81
0.83
APE
8.68
9.18
8.24
Regression
NS
NS
*
% Correct
49.5
47.2
35.7
% Within 1 Year
78
59.4
81.3