

334
D.G. Chen
1.0
1.0
,...-------a)
Warm
b)
J
J
J
J
0.8
0.8
J
J
c:
c:
J
0
0
J
Ü
t5
c:
c:
J
"
"
J
~0.6
~0.6
J
:E
:E
J
~
~
Ql
Ql
J
.0
I
.0
E
J
E
J
~04
J
~04
J
>J
>J
J::j
J
J::j
I
"
J
"
I
lL
lL
I
I
0.2
J
0.2
I
I
I
I
I
I
I
I
I
0.0
____ J
0.0
_______ J
0.0
0.2
0.4
0.6
0.8
1.0
0.0
0.2
0.4
0.6
0.8
1.0
SST
SST
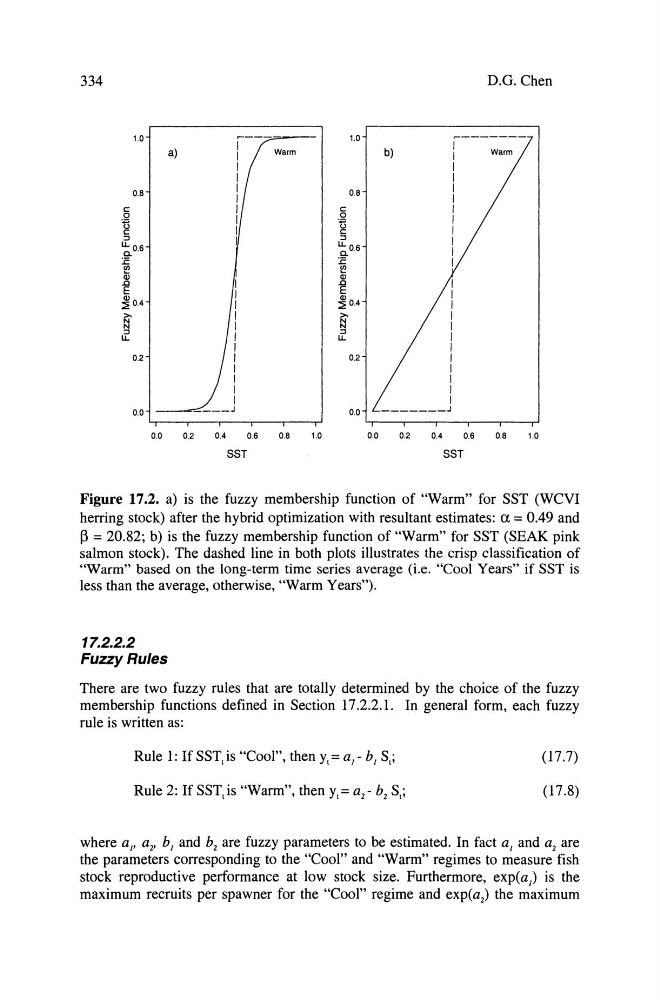
Figure 17.2. a) is the fuzzy membership function of "Warm" for SST (WCVI
herring stock) after the hybrid optimization with resultant estimates: a = 0.49 and
ß = 20.82; b) is the fuzzy membership function of "Warm" for SST (SEAK pink
salmon stock). The dashed line in both plots illustrates the crisp classification of
"Warm" based on the long-term time series average (i.e. "Cool Years" if SST is
less than the average, otherwise, "Warm Years").
17.2.2.2
FuzzyRules
There are two fuzzy rules that are totally determined by the choice of the fuzzy
membership functions defined in Section 17.2.2.1. In general form, each fuzzy
rule is written as:
(17.7)
(17.8)
where a J , a 2 , b J and b 2 are fuzzy parameters to be estimated. In fact a J and a 2 are
the parameters corresponding to the "Cool" and "Warm" regimes to measure fish
stock reproductive performance at low stock size. Furthermore, exp(a) is the
maximum recruits per spawner for the "Cool" regime and exp(a 2 ) the maximum
D.G. Chen
1.0
1.0
,...-------a)
Warm
b)
J
J
J
J
0.8
0.8
J
J
c:
c:
J
0
0
J
Ü
t5
c:
c:
J
"
"
J
~0.6
~0.6
J
:E
:E
J
~
~
Ql
Ql
J
.0
I
.0
E
J
E
J
~04
J
~04
J
>J
>J
J::j
J
J::j
I
"
J
"
I
lL
lL
I
I
0.2
J
0.2
I
I
I
I
I
I
I
I
I
0.0
____ J
0.0
_______ J
0.0
0.2
0.4
0.6
0.8
1.0
0.0
0.2
0.4
0.6
0.8
1.0
SST
SST
Figure 17.2. a) is the fuzzy membership function of "Warm" for SST (WCVI
herring stock) after the hybrid optimization with resultant estimates: a = 0.49 and
ß = 20.82; b) is the fuzzy membership function of "Warm" for SST (SEAK pink
salmon stock). The dashed line in both plots illustrates the crisp classification of
"Warm" based on the long-term time series average (i.e. "Cool Years" if SST is
less than the average, otherwise, "Warm Years").
17.2.2.2
FuzzyRules
There are two fuzzy rules that are totally determined by the choice of the fuzzy
membership functions defined in Section 17.2.2.1. In general form, each fuzzy
rule is written as:
(17.7)
(17.8)
where a J , a 2 , b J and b 2 are fuzzy parameters to be estimated. In fact a J and a 2 are
the parameters corresponding to the "Cool" and "Warm" regimes to measure fish
stock reproductive performance at low stock size. Furthermore, exp(a) is the
maximum recruits per spawner for the "Cool" regime and exp(a 2 ) the maximum