

introduced a graph-theoretic model for landscape connectivity, where
connections between patches are determined by interpatch distances rather
than by adjacency on a lattice. They showed that critical transitions in
connectivity occur not only for habitat loss but also as organisms’ dispersal
ability is decreased. In their study of Mexican spotted owls, they showed
that critical dispersal distances for maintaining immigration into habitat
patches were approximately 45 km in the southwestern United States.
Dispersal distances shorter than 45 km resulted in isolated populations.
They also demonstrated how these distances could be converted into
parameter estimates for a probabilistic dispersal function. An advantage
of their approach was that it allowed not only quantitative measures of
connectivity in real landscapes but also sensitivity analysis to determine
which patches were critical to the maintenance of immigration and gene
flow in fragmented landscapes.
128
Timothy H. Keitt
0
0
0.2
0.4
0.6
0.8
1
0.2
0.4
Fraction habitat lost
Fraction remaining habitat occupied
0.6
0.8
1
Random
Spanning tree
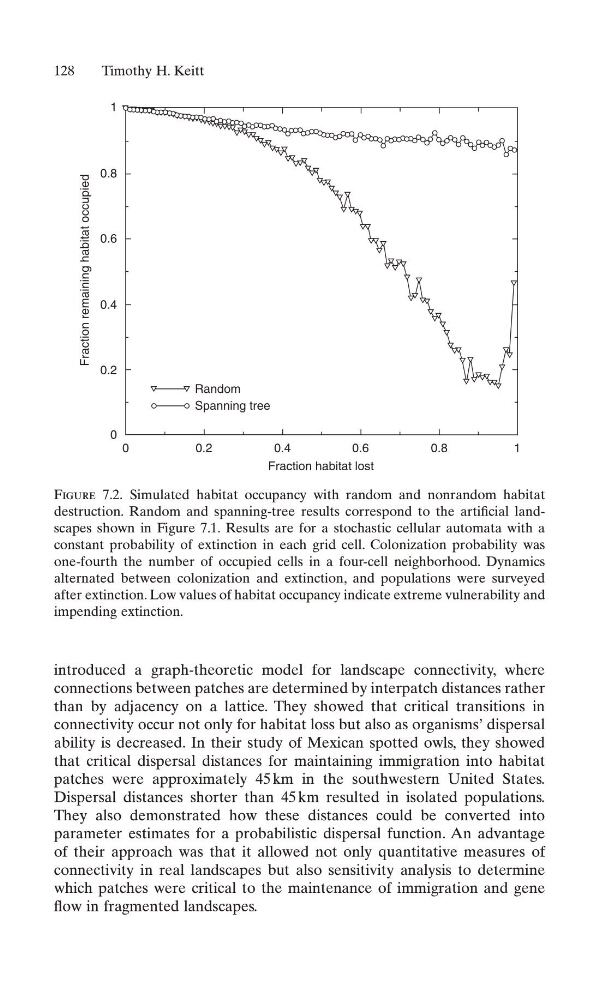
Figure 7.2. Simulated habitat occupancy with random and nonrandom habitat
destruction. Random and spanning-tree results correspond to the artificial landscapes shown in Figure 7.1. Results are for a stochastic cellular automata with a
constant probability of extinction in each grid cell. Colonization probability was
one-fourth the number of occupied cells in a four-cell neighborhood. Dynamics
alternated between colonization and extinction, and populations were surveyed
after extinction. Low values of habitat occupancy indicate extreme vulnerability and
impending extinction.
connections between patches are determined by interpatch distances rather
than by adjacency on a lattice. They showed that critical transitions in
connectivity occur not only for habitat loss but also as organisms’ dispersal
ability is decreased. In their study of Mexican spotted owls, they showed
that critical dispersal distances for maintaining immigration into habitat
patches were approximately 45 km in the southwestern United States.
Dispersal distances shorter than 45 km resulted in isolated populations.
They also demonstrated how these distances could be converted into
parameter estimates for a probabilistic dispersal function. An advantage
of their approach was that it allowed not only quantitative measures of
connectivity in real landscapes but also sensitivity analysis to determine
which patches were critical to the maintenance of immigration and gene
flow in fragmented landscapes.
128
Timothy H. Keitt
0
0
0.2
0.4
0.6
0.8
1
0.2
0.4
Fraction habitat lost
Fraction remaining habitat occupied
0.6
0.8
1
Random
Spanning tree
Figure 7.2. Simulated habitat occupancy with random and nonrandom habitat
destruction. Random and spanning-tree results correspond to the artificial landscapes shown in Figure 7.1. Results are for a stochastic cellular automata with a
constant probability of extinction in each grid cell. Colonization probability was
one-fourth the number of occupied cells in a four-cell neighborhood. Dynamics
alternated between colonization and extinction, and populations were surveyed
after extinction. Low values of habitat occupancy indicate extreme vulnerability and
impending extinction.