

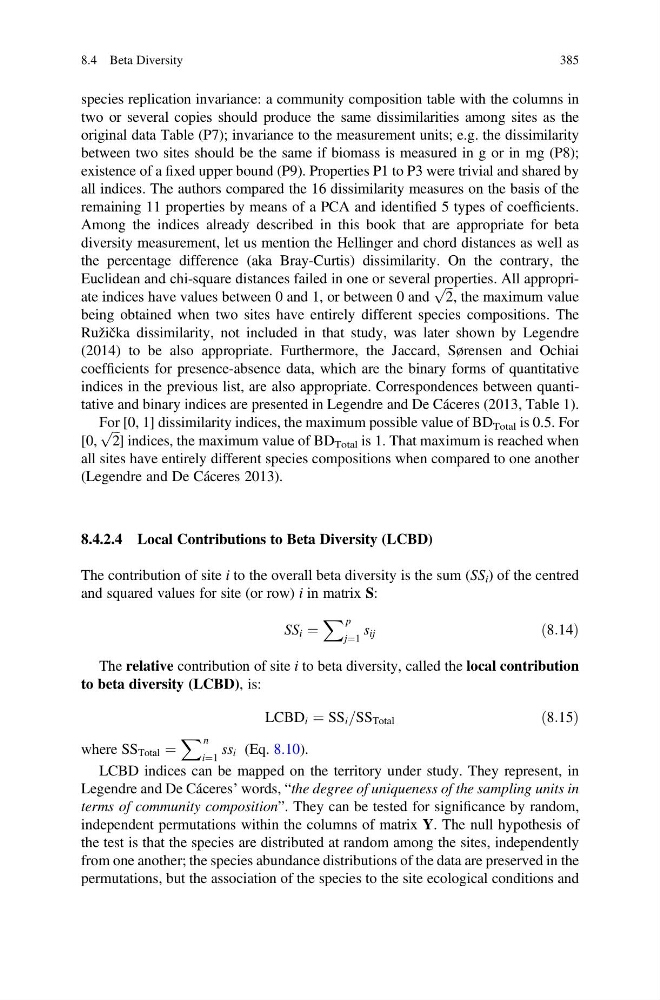
species replication invariance: a community composition table with the columns in
two or several copies should produce the same dissimilarities among sites as the
original data Table (P7); invariance to the measurement units; e.g. the dissimilarity
between two sites should be the same if biomass is measured in g or in mg (P8);
existence of a fixed upper bound (P9). Properties P1 to P3 were trivial and shared by
all indices. The authors compared the 16 dissimilarity measures on the basis of the
remaining 11 properties by means of a PCA and identified 5 types of coefficients.
Among the indices already described in this book that are appropriate for beta
diversity measurement, let us mention the Hellinger and chord distances as well as
the percentage difference (aka Bray-Curtis) dissimilarity. On the contrary, the
Euclidean and chi-square distances failed in one or several properties. All appropriate indices have values between 0 and 1, or between 0 and
ffiffi ffi
2
p
, the maximum value
being obtained when two sites have entirely different species compositions. The
Ružička dissimilarity, not included in that study, was later shown by Legendre
(2014) to be also appropriate. Furthermore, the Jaccard, Sørensen and Ochiai
coefficients for presence-absence data, which are the binary forms of quantitative
indices in the previous list, are also appropriate. Correspondences between quantitative and binary indices are presented in Legendre and De Cáceres (2013, Table 1).
For [0, 1] dissimilarity indices, the maximum possible value of BD Total is 0.5. For
[0,
ffiffi ffi
2
p
] indices, the maximum value of BD Total is 1. That maximum is reached when
all sites have entirely different species compositions when compared to one another
(Legendre and De Cáceres 2013).
8.4.2.4 Local Contributions to Beta Diversity (LCBD)
The contribution of site i to the overall beta diversity is the sum (SS i ) of the centred
and squared values for site (or row) i in matrix S:
SS i ¼
X p
j¼1
s ij
ð8:14Þ
The relative contribution of site i to beta diversity, called the local contribution
to beta diversity (LCBD), is:
LCBD i ¼ SS i =SS Total
ð8:15Þ
where SS Total ¼
X n
i¼1
ss i (Eq. 8.10).
LCBD indices can be mapped on the territory under study. They represent, in
Legendre and De Cáceres’ words, “the degree of uniqueness of the sampling units in
terms of community composition”. They can be tested for significance by random,
independent permutations within the columns of matrix Y. The null hypothesis of
the test is that the species are distributed at random among the sites, independently
from one another; the species abundance distributions of the data are preserved in the
permutations, but the association of the species to the site ecological conditions and
8.4 Beta Diversity
385
two or several copies should produce the same dissimilarities among sites as the
original data Table (P7); invariance to the measurement units; e.g. the dissimilarity
between two sites should be the same if biomass is measured in g or in mg (P8);
existence of a fixed upper bound (P9). Properties P1 to P3 were trivial and shared by
all indices. The authors compared the 16 dissimilarity measures on the basis of the
remaining 11 properties by means of a PCA and identified 5 types of coefficients.
Among the indices already described in this book that are appropriate for beta
diversity measurement, let us mention the Hellinger and chord distances as well as
the percentage difference (aka Bray-Curtis) dissimilarity. On the contrary, the
Euclidean and chi-square distances failed in one or several properties. All appropriate indices have values between 0 and 1, or between 0 and
ffiffi ffi
2
p
, the maximum value
being obtained when two sites have entirely different species compositions. The
Ružička dissimilarity, not included in that study, was later shown by Legendre
(2014) to be also appropriate. Furthermore, the Jaccard, Sørensen and Ochiai
coefficients for presence-absence data, which are the binary forms of quantitative
indices in the previous list, are also appropriate. Correspondences between quantitative and binary indices are presented in Legendre and De Cáceres (2013, Table 1).
For [0, 1] dissimilarity indices, the maximum possible value of BD Total is 0.5. For
[0,
ffiffi ffi
2
p
] indices, the maximum value of BD Total is 1. That maximum is reached when
all sites have entirely different species compositions when compared to one another
(Legendre and De Cáceres 2013).
8.4.2.4 Local Contributions to Beta Diversity (LCBD)
The contribution of site i to the overall beta diversity is the sum (SS i ) of the centred
and squared values for site (or row) i in matrix S:
SS i ¼
X p
j¼1
s ij
ð8:14Þ
The relative contribution of site i to beta diversity, called the local contribution
to beta diversity (LCBD), is:
LCBD i ¼ SS i =SS Total
ð8:15Þ
where SS Total ¼
X n
i¼1
ss i (Eq. 8.10).
LCBD indices can be mapped on the territory under study. They represent, in
Legendre and De Cáceres’ words, “the degree of uniqueness of the sampling units in
terms of community composition”. They can be tested for significance by random,
independent permutations within the columns of matrix Y. The null hypothesis of
the test is that the species are distributed at random among the sites, independently
from one another; the species abundance distributions of the data are preserved in the
permutations, but the association of the species to the site ecological conditions and
8.4 Beta Diversity
385