

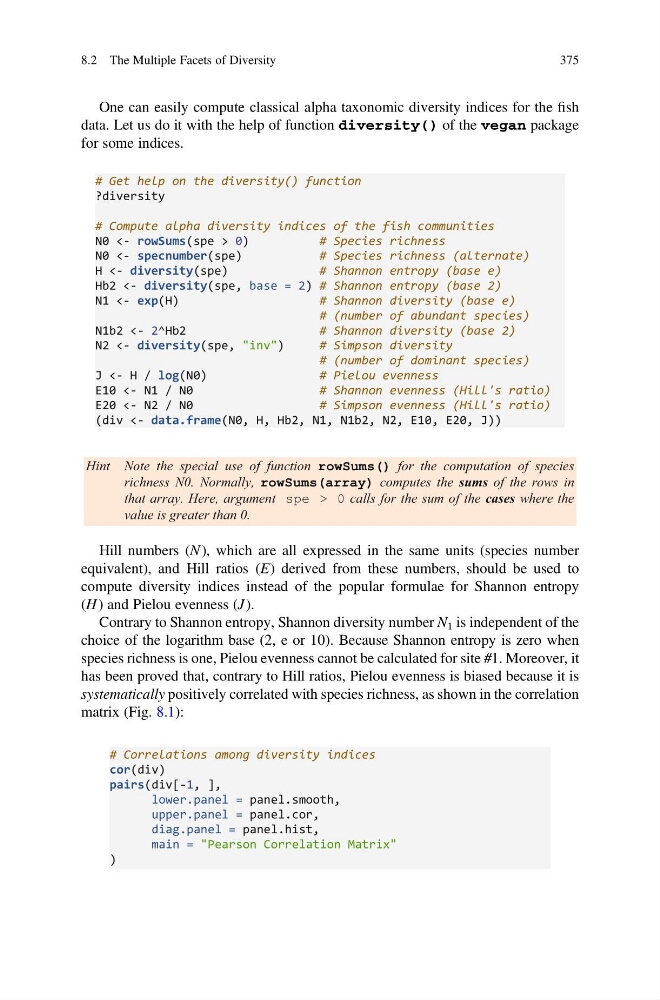
One can easily compute classical alpha taxonomic diversity indices for the fish
data. Let us do it with the help of function diversity() of the vegan package
for some indices.
# Get help on the diversity() function
?diversity
# Compute alpha diversity indices of the fish communities
N0 <- rowSums(spe > 0)
# Species richness
N0 <- specnumber(spe)
# Species richness (alternate)
H <- diversity(spe)
# Shannon entropy (base e)
Hb2 <- diversity(spe, base = 2) # Shannon entropy (base 2)
N1 <- exp(H)
# Shannon diversity (base e)
# (number of abundant species)
N1b2 <- 2^Hb2
# Shannon diversity (base 2)
N2 <- diversity(spe, "inv")
# Simpson diversity
# (number of dominant species)
J <- H / log(N0)
# Pielou evenness
E10 <- N1 / N0
# Shannon evenness (Hill's ratio)
E20 <- N2 / N0
# Simpson evenness (Hill's ratio)
(div <- data.frame(N0, H, Hb2, N1, N1b2, N2, E10, E20, J))
Hint Note the special use of function rowSums() for the computation of species
richness N0. Normally, rowSums(array) computes the sums of the rows in
that array. Here, argument spe > 0 calls for the sum of the cases where the
value is greater than 0.
Hill numbers (N ), which are all expressed in the same units (species number
equivalent), and Hill ratios (E) derived from these numbers, should be used to
compute diversity indices instead of the popular formulae for Shannon entropy
(H ) and Pielou evenness (J ).
Contrary to Shannon entropy, Shannon diversity number N 1 is independent of the
choice of the logarithm base (2, e or 10). Because Shannon entropy is zero when
species richness is one, Pielou evenness cannot be calculated for site #1. Moreover, it
has been proved that, contrary to Hill ratios, Pielou evenness is biased because it is
systematically positively correlated with species richness, as shown in the correlation
matrix (Fig. 8.1):
# Correlations among diversity indices
cor(div)
pairs(div[-1, ],
lower.panel = panel.smooth,
upper.panel = panel.cor,
diag.panel = panel.hist,
main = "Pearson Correlation Matrix"
)
8.2 The Multiple Facets of Diversity
375
data. Let us do it with the help of function diversity() of the vegan package
for some indices.
# Get help on the diversity() function
?diversity
# Compute alpha diversity indices of the fish communities
N0 <- rowSums(spe > 0)
# Species richness
N0 <- specnumber(spe)
# Species richness (alternate)
H <- diversity(spe)
# Shannon entropy (base e)
Hb2 <- diversity(spe, base = 2) # Shannon entropy (base 2)
N1 <- exp(H)
# Shannon diversity (base e)
# (number of abundant species)
N1b2 <- 2^Hb2
# Shannon diversity (base 2)
N2 <- diversity(spe, "inv")
# Simpson diversity
# (number of dominant species)
J <- H / log(N0)
# Pielou evenness
E10 <- N1 / N0
# Shannon evenness (Hill's ratio)
E20 <- N2 / N0
# Simpson evenness (Hill's ratio)
(div <- data.frame(N0, H, Hb2, N1, N1b2, N2, E10, E20, J))
Hint Note the special use of function rowSums() for the computation of species
richness N0. Normally, rowSums(array) computes the sums of the rows in
that array. Here, argument spe > 0 calls for the sum of the cases where the
value is greater than 0.
Hill numbers (N ), which are all expressed in the same units (species number
equivalent), and Hill ratios (E) derived from these numbers, should be used to
compute diversity indices instead of the popular formulae for Shannon entropy
(H ) and Pielou evenness (J ).
Contrary to Shannon entropy, Shannon diversity number N 1 is independent of the
choice of the logarithm base (2, e or 10). Because Shannon entropy is zero when
species richness is one, Pielou evenness cannot be calculated for site #1. Moreover, it
has been proved that, contrary to Hill ratios, Pielou evenness is biased because it is
systematically positively correlated with species richness, as shown in the correlation
matrix (Fig. 8.1):
# Correlations among diversity indices
cor(div)
pairs(div[-1, ],
lower.panel = panel.smooth,
upper.panel = panel.cor,
diag.panel = panel.hist,
main = "Pearson Correlation Matrix"
)
8.2 The Multiple Facets of Diversity
375