

8.2.3.2 Rarefaction Analysis of the Mite Communities
Hurlbert’s (1971) rarefaction can be computed by means of the function rarefy()
of package vegan. The Doubs fish species data cannot be used in this example
because the abundances are measured on a 0–5 scale. Let us compute a rarefaction
analysis of the mite data.
Generally, one computes the number of expected species (one “rarefies”) to a
“sample size” (remember that here this refers to the number of individuals) equal to
the number of individuals of the sampling unit where the abundance is the smallest.
However, in this data set, most units (soil cores) contain 80 or more individuals, and
only a handful contain fewer, with the minimum being 8. Therefore, let us rarefy the
data set to a sample size of 80 individuals (and receive a warning because of that).
N0
1.0 2.0 3.0
0.978
***
0.978
***
5 15
0.997
***
0.997
***
5
15
0.99
***
0.091
0.70 0.85
0.059
5 15
25
0.59
***
1.0 2.0 3.0
H
1
***
0.976
***
0.976
***
0.969
***
0.061
0.016
0.585
**
Hb2
0.976
***
0.976
***
0.969
***
0.061
0.016
1.5 3.0 4.5
0.585
**
5 15
N1
1
***
0.998
***
0.153
0.122
0.63
***
N1b2
0.998
***
0.153
0.122
5 15
0.63
***
5 15
N2
0.2
0.176
0.655
***
E10
0.971
***
0.85
0.95
0.813
***
0.70 0.85
E20
0.74
***
5 15 25
1.5 3.0 4.5
5 15
0.85 0.95
0.88 0.94
0.88 0.94
J
Pearson Correlation Matrix
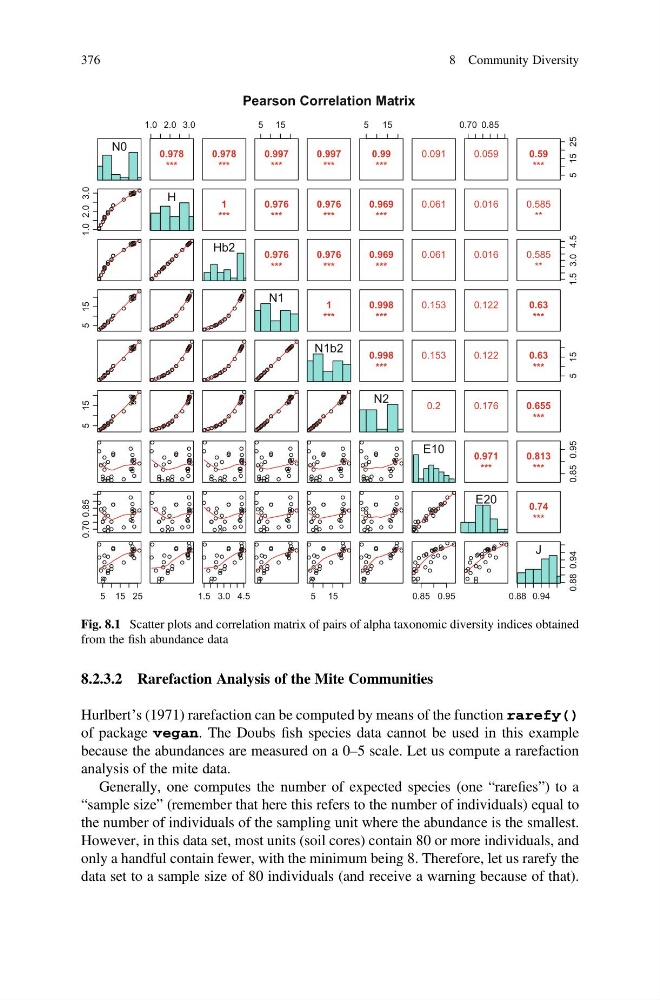
Fig. 8.1 Scatter plots and correlation matrix of pairs of alpha taxonomic diversity indices obtained
from the fish abundance data
376
8 Community Diversity
Hurlbert’s (1971) rarefaction can be computed by means of the function rarefy()
of package vegan. The Doubs fish species data cannot be used in this example
because the abundances are measured on a 0–5 scale. Let us compute a rarefaction
analysis of the mite data.
Generally, one computes the number of expected species (one “rarefies”) to a
“sample size” (remember that here this refers to the number of individuals) equal to
the number of individuals of the sampling unit where the abundance is the smallest.
However, in this data set, most units (soil cores) contain 80 or more individuals, and
only a handful contain fewer, with the minimum being 8. Therefore, let us rarefy the
data set to a sample size of 80 individuals (and receive a warning because of that).
N0
1.0 2.0 3.0
0.978
***
0.978
***
5 15
0.997
***
0.997
***
5
15
0.99
***
0.091
0.70 0.85
0.059
5 15
25
0.59
***
1.0 2.0 3.0
H
1
***
0.976
***
0.976
***
0.969
***
0.061
0.016
0.585
**
Hb2
0.976
***
0.976
***
0.969
***
0.061
0.016
1.5 3.0 4.5
0.585
**
5 15
N1
1
***
0.998
***
0.153
0.122
0.63
***
N1b2
0.998
***
0.153
0.122
5 15
0.63
***
5 15
N2
0.2
0.176
0.655
***
E10
0.971
***
0.85
0.95
0.813
***
0.70 0.85
E20
0.74
***
5 15 25
1.5 3.0 4.5
5 15
0.85 0.95
0.88 0.94
0.88 0.94
J
Pearson Correlation Matrix
Fig. 8.1 Scatter plots and correlation matrix of pairs of alpha taxonomic diversity indices obtained
from the fish abundance data
376
8 Community Diversity