

likely elements (individuals, species, etc.) needed to produce the observed value of
the diversity index” (Ellison 2010; sentence modified from Jost 2007). Diversity
numbers are also preferable for interpretation through linear models because they are
more likely to be in linear relationship with environmental variables. These true
diversity indices (sensu Jost 2006) are part of a unified framework for community
diversity, including taxonomic, functional and phylogenetic facets and its
partitioning into alpha, beta and gamma components (de Bello et al. 2010). This
topic is addressed in Sect. 8.5.2.
8.2.3 Taxonomic Diversity Indices in Practice
8.2.3.1 Species Diversity Indices of the Fish Communities of the Doubs
River
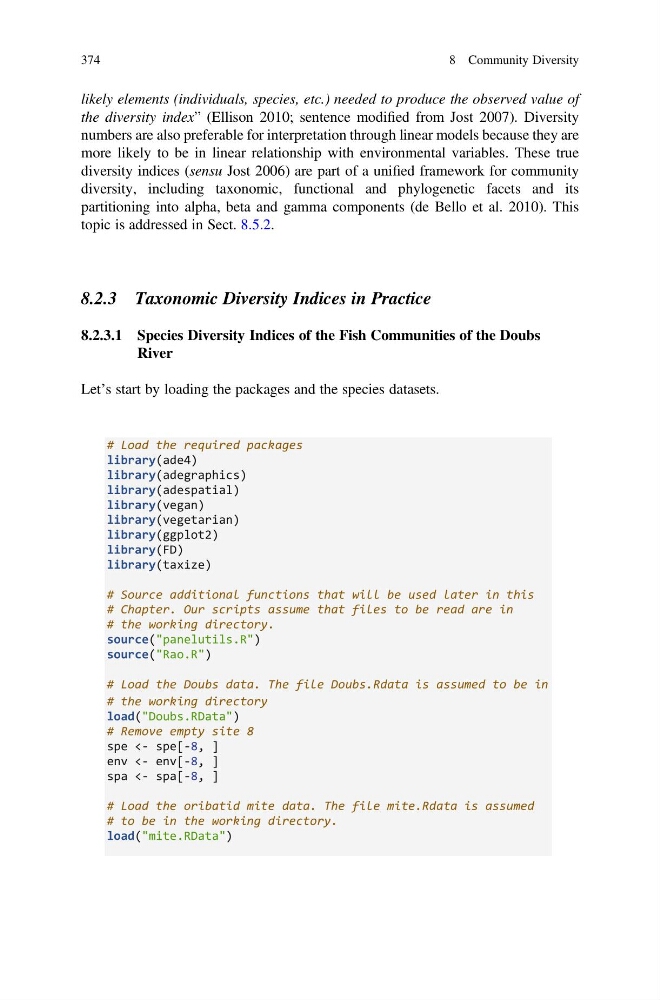
Let’s start by loading the packages and the species datasets.
# Load the required packages
library(ade4)
library(adegraphics)
library(adespatial)
library(vegan)
library(vegetarian)
library(ggplot2)
library(FD)
library(taxize)
# Source additional functions that will be used later in this
# Chapter. Our scripts assume that files to be read are in
# the working directory.
source("panelutils.R")
source("Rao.R")
# Load the Doubs data. The file Doubs.Rdata is assumed to be in
# the working directory
load("Doubs.RData")
# Remove empty site 8
spe <- spe[-8, ]
env <- env[-8, ]
spa <- spa[-8, ]
# Load the oribatid mite data. The file mite.Rdata is assumed
# to be in the working directory.
load("mite.RData")
374
8 Community Diversity
the diversity index” (Ellison 2010; sentence modified from Jost 2007). Diversity
numbers are also preferable for interpretation through linear models because they are
more likely to be in linear relationship with environmental variables. These true
diversity indices (sensu Jost 2006) are part of a unified framework for community
diversity, including taxonomic, functional and phylogenetic facets and its
partitioning into alpha, beta and gamma components (de Bello et al. 2010). This
topic is addressed in Sect. 8.5.2.
8.2.3 Taxonomic Diversity Indices in Practice
8.2.3.1 Species Diversity Indices of the Fish Communities of the Doubs
River
Let’s start by loading the packages and the species datasets.
# Load the required packages
library(ade4)
library(adegraphics)
library(adespatial)
library(vegan)
library(vegetarian)
library(ggplot2)
library(FD)
library(taxize)
# Source additional functions that will be used later in this
# Chapter. Our scripts assume that files to be read are in
# the working directory.
source("panelutils.R")
source("Rao.R")
# Load the Doubs data. The file Doubs.Rdata is assumed to be in
# the working directory
load("Doubs.RData")
# Remove empty site 8
spe <- spe[-8, ]
env <- env[-8, ]
spa <- spa[-8, ]
# Load the oribatid mite data. The file mite.Rdata is assumed
# to be in the working directory.
load("mite.RData")
374
8 Community Diversity