

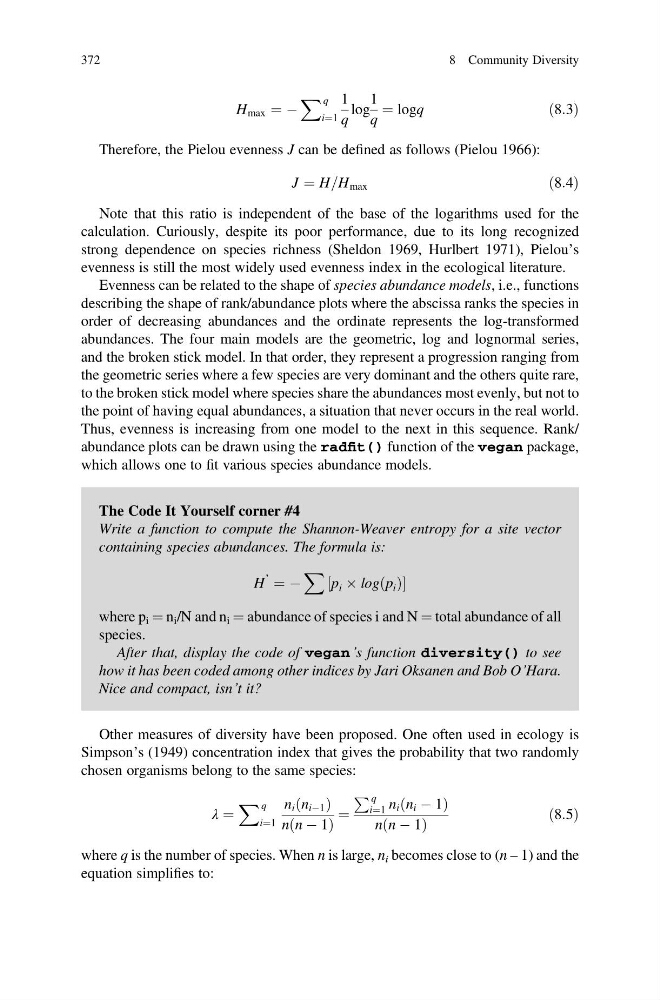
H max ¼ À
X q
i¼1
1
q
log
1
q
¼ logq
ð8:3Þ
Therefore, the Pielou evenness J can be defined as follows (Pielou 1966):
J ¼ H=H max
ð8:4Þ
Note that this ratio is independent of the base of the logarithms used for the
calculation. Curiously, despite its poor performance, due to its long recognized
strong dependence on species richness (Sheldon 1969, Hurlbert 1971), Pielou’s
evenness is still the most widely used evenness index in the ecological literature.
Evenness can be related to the shape of species abundance models, i.e., functions
describing the shape of rank/abundance plots where the abscissa ranks the species in
order of decreasing abundances and the ordinate represents the log-transformed
abundances. The four main models are the geometric, log and lognormal series,
and the broken stick model. In that order, they represent a progression ranging from
the geometric series where a few species are very dominant and the others quite rare,
to the broken stick model where species share the abundances most evenly, but not to
the point of having equal abundances, a situation that never occurs in the real world.
Thus, evenness is increasing from one model to the next in this sequence. Rank/
abundance plots can be drawn using the radfit() function of the vegan package,
which allows one to fit various species abundance models.
The Code It Yourself corner #4
Write a function to compute the Shannon-Weaver entropy for a site vector
containing species abundances. The formula is:
H
’
¼ À
X
p i  log p i
ð Þ
½
where p i ¼ n i /N and n i ¼ abundance of species i and N ¼ total abundance of all
species.
After that, display the code of vegan’s function diversity() to see
how it has been coded among other indices by Jari Oksanen and Bob O’Hara.
Nice and compact, isn’t it?
Other measures of diversity have been proposed. One often used in ecology is
Simpson’s (1949) concentration index that gives the probability that two randomly
chosen organisms belong to the same species:
λ ¼
X q
i¼1
n i n iÀ1
ð
Þ
n n À 1
ð
Þ
¼
P q
i¼1 n i n i À 1
ð
Þ
n n À 1
ð
Þ
ð8:5Þ
where q is the number of species. When n is large, n i becomes close to (n – 1) and the
equation simplifies to:
372
8 Community Diversity
X q
i¼1
1
q
log
1
q
¼ logq
ð8:3Þ
Therefore, the Pielou evenness J can be defined as follows (Pielou 1966):
J ¼ H=H max
ð8:4Þ
Note that this ratio is independent of the base of the logarithms used for the
calculation. Curiously, despite its poor performance, due to its long recognized
strong dependence on species richness (Sheldon 1969, Hurlbert 1971), Pielou’s
evenness is still the most widely used evenness index in the ecological literature.
Evenness can be related to the shape of species abundance models, i.e., functions
describing the shape of rank/abundance plots where the abscissa ranks the species in
order of decreasing abundances and the ordinate represents the log-transformed
abundances. The four main models are the geometric, log and lognormal series,
and the broken stick model. In that order, they represent a progression ranging from
the geometric series where a few species are very dominant and the others quite rare,
to the broken stick model where species share the abundances most evenly, but not to
the point of having equal abundances, a situation that never occurs in the real world.
Thus, evenness is increasing from one model to the next in this sequence. Rank/
abundance plots can be drawn using the radfit() function of the vegan package,
which allows one to fit various species abundance models.
The Code It Yourself corner #4
Write a function to compute the Shannon-Weaver entropy for a site vector
containing species abundances. The formula is:
H
’
¼ À
X
p i  log p i
ð Þ
½
where p i ¼ n i /N and n i ¼ abundance of species i and N ¼ total abundance of all
species.
After that, display the code of vegan’s function diversity() to see
how it has been coded among other indices by Jari Oksanen and Bob O’Hara.
Nice and compact, isn’t it?
Other measures of diversity have been proposed. One often used in ecology is
Simpson’s (1949) concentration index that gives the probability that two randomly
chosen organisms belong to the same species:
λ ¼
X q
i¼1
n i n iÀ1
ð
Þ
n n À 1
ð
Þ
¼
P q
i¼1 n i n i À 1
ð
Þ
n n À 1
ð
Þ
ð8:5Þ
where q is the number of species. When n is large, n i becomes close to (n – 1) and the
equation simplifies to:
372
8 Community Diversity