

comparison of the species richness of two sampling units and/or two groups of
individuals, which are estimates of the true numbers of species, is biased.
Magurran (2004) points out the distinction between species density, defined as
the number of species per specified collection area (Hurlbert 1971) and numerical
species richness , which is the number of species per specified number of individuals
or biomass unit (Kempton 1979). To ensure comparability between two sites,
Sanders (1968) proposed a rarefaction method, which estimates the number of
species in sampling units containing the same number of individuals; it is therefore
based on the concept of numerical species richness. An important point is that
rarefaction can only be computed on true (untransformed) counts of individuals.
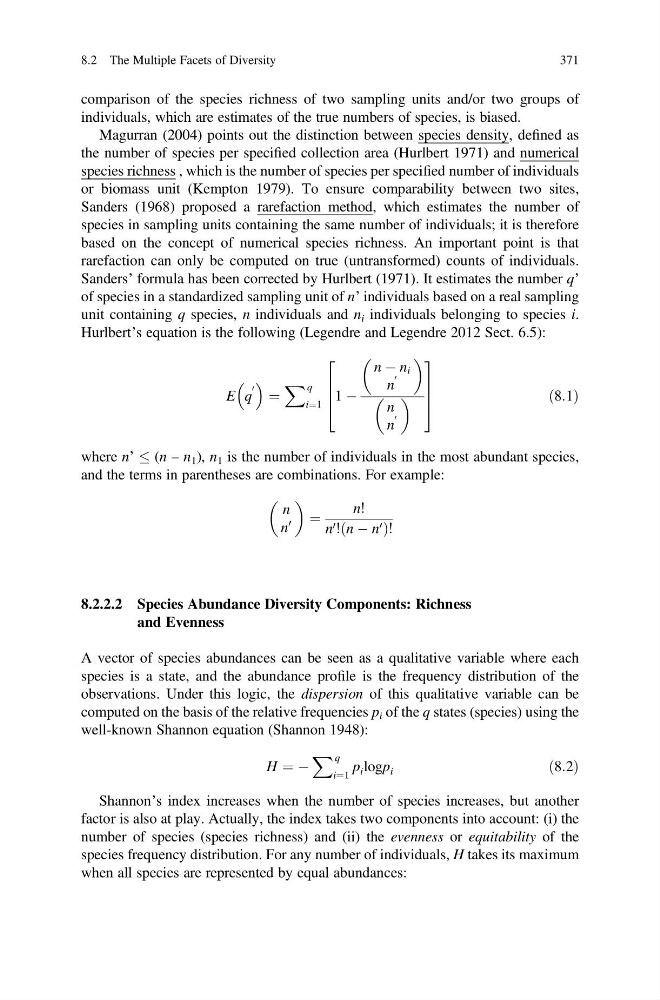
Sanders’ formula has been corrected by Hurlbert (1971). It estimates the number q’
of species in a standardized sampling unit of n’ individuals based on a real sampling
unit containing q species, n individuals and n i individuals belonging to species i.
Hurlbert’s equation is the following (Legendre and Legendre 2012 Sect. 6.5):
E q
0
¼
X q
i¼1
1 À
n À n i
n
0
n
n
0
2
6
6
4
3
7
7
5
ð8:1Þ
where n’ (n – n 1 ), n 1 is the number of individuals in the most abundant species,
and the terms in parentheses are combinations. For example:
n
n
0
¼
n!
n 0 ! n À n 0
ð
Þ!
8.2.2.2 Species Abundance Diversity Components: Richness
and Evenness
A vector of species abundances can be seen as a qualitative variable where each
species is a state, and the abundance profile is the frequency distribution of the
observations. Under this logic, the dispersion of this qualitative variable can be
computed on the basis of the relative frequencies p i of the q states (species) using the
well-known Shannon equation (Shannon 1948):
H ¼ À
X q
i¼1
p i logp i
ð8:2Þ
Shannon’s index increases when the number of species increases, but another
factor is also at play. Actually, the index takes two components into account: (i) the
number of species (species richness) and (ii) the evenness or equitability of the
species frequency distribution. For any number of individuals, H takes its maximum
when all species are represented by equal abundances:
8.2 The Multiple Facets of Diversity
371
individuals, which are estimates of the true numbers of species, is biased.
Magurran (2004) points out the distinction between species density, defined as
the number of species per specified collection area (Hurlbert 1971) and numerical
species richness , which is the number of species per specified number of individuals
or biomass unit (Kempton 1979). To ensure comparability between two sites,
Sanders (1968) proposed a rarefaction method, which estimates the number of
species in sampling units containing the same number of individuals; it is therefore
based on the concept of numerical species richness. An important point is that
rarefaction can only be computed on true (untransformed) counts of individuals.
Sanders’ formula has been corrected by Hurlbert (1971). It estimates the number q’
of species in a standardized sampling unit of n’ individuals based on a real sampling
unit containing q species, n individuals and n i individuals belonging to species i.
Hurlbert’s equation is the following (Legendre and Legendre 2012 Sect. 6.5):
E q
0
¼
X q
i¼1
1 À
n À n i
n
0
n
n
0
2
6
6
4
3
7
7
5
ð8:1Þ
where n’ (n – n 1 ), n 1 is the number of individuals in the most abundant species,
and the terms in parentheses are combinations. For example:
n
n
0
¼
n!
n 0 ! n À n 0
ð
Þ!
8.2.2.2 Species Abundance Diversity Components: Richness
and Evenness
A vector of species abundances can be seen as a qualitative variable where each
species is a state, and the abundance profile is the frequency distribution of the
observations. Under this logic, the dispersion of this qualitative variable can be
computed on the basis of the relative frequencies p i of the q states (species) using the
well-known Shannon equation (Shannon 1948):
H ¼ À
X q
i¼1
p i logp i
ð8:2Þ
Shannon’s index increases when the number of species increases, but another
factor is also at play. Actually, the index takes two components into account: (i) the
number of species (species richness) and (ii) the evenness or equitability of the
species frequency distribution. For any number of individuals, H takes its maximum
when all species are represented by equal abundances:
8.2 The Multiple Facets of Diversity
371