

The multiple factor analysis result provides an interesting picture of two main
gradients and of the relationships among the three groups of variables. The first two
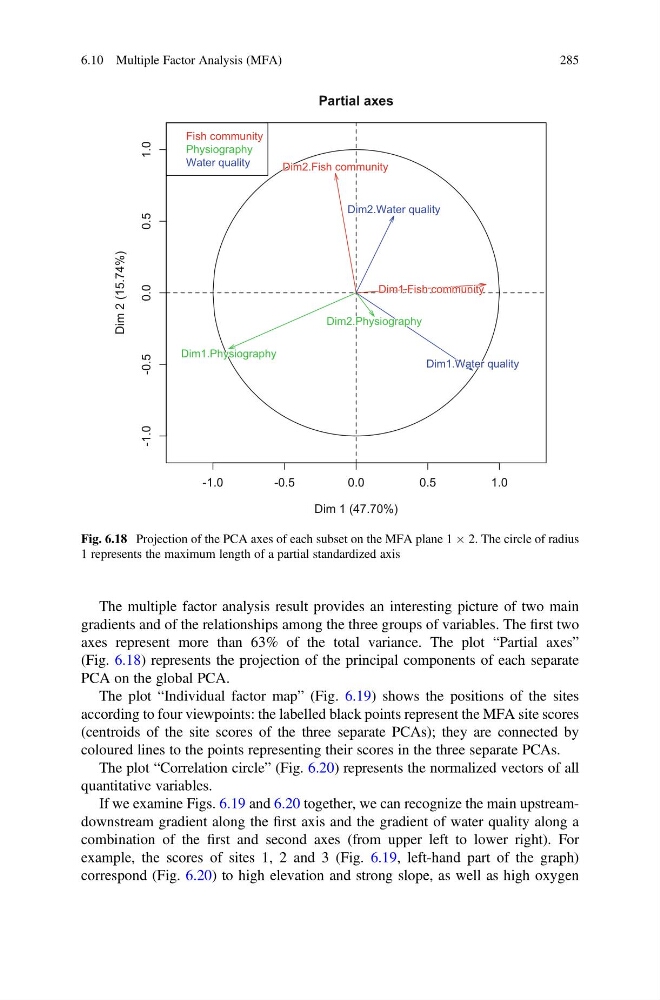
axes represent more than 63% of the total variance. The plot “Partial axes”
(Fig. 6.18) represents the projection of the principal components of each separate
PCA on the global PCA.
The plot “Individual factor map” (Fig. 6.19) shows the positions of the sites
according to four viewpoints: the labelled black points represent the MFA site scores
(centroids of the site scores of the three separate PCAs); they are connected by
coloured lines to the points representing their scores in the three separate PCAs.
The plot “Correlation circle” (Fig. 6.20) represents the normalized vectors of all
quantitative variables.
If we examine Figs. 6.19 and 6.20 together, we can recognize the main upstreamdownstream gradient along the first axis and the gradient of water quality along a
combination of the first and second axes (from upper left to lower right). For
example, the scores of sites 1, 2 and 3 (Fig. 6.19, left-hand part of the graph)
correspond (Fig. 6.20) to high elevation and strong slope, as well as high oxygen
-1.0
-0.5
0.0
0.5
1.0
-1.0
-0.5
0.0
0.5
1.0
Partial axes
Dim 1 (47.70%)
Dim 2 (15.74%)
Dim1.Fish community
Dim2.Fish community
Dim1.Physiography
Dim2.Physiography
Dim1.Water quality
Dim2.Water quality
Dim1.Fish community
Dim2.Fish community
Dim1.Physiography
Dim2.Physiography
Dim1.Water quality
Dim2.Water quality
Dim1.Fish community
Dim2.Fish community
Dim1.Physiography
Dim2.Physiography
Dim1.Water quality
Dim2.Water quality
Dim1.Fish community
Dim2.Fish community
Dim1.Physiography
Dim2.Physiography
Dim1.Water quality
Dim2.Water quality
Dim1.Fish community
Dim2.Fish community
Dim1.Physiography
Dim2.Physiography
Dim1.Water quality
Dim2.Water quality
Dim1.Fish community
Dim2.Fish community
Dim1.Physiography
Dim2.Physiography
Dim1.Water quality
Dim2.Water quality
Dim1.Fish community
Dim2.Fish community
Dim1.Physiography
Dim2.Physiography
Dim1.Water quality
Dim2.Water quality
Dim1.Fish community
Dim2.Fish community
Dim1.Physiography
Dim2.Physiography
Dim1.Water quality
Dim2.Water quality
Dim1.Fish community
Dim2.Fish community
Dim1.Physiography
Dim2.Physiography
Dim1.Water quality
Dim2.Water quality
Fish community
Physiography
Water quality
Fig. 6.18 Projection of the PCA axes of each subset on the MFA plane 1 Â 2. The circle of radius
1 represents the maximum length of a partial standardized axis
6.10 Multiple Factor Analysis (MFA)
285
gradients and of the relationships among the three groups of variables. The first two
axes represent more than 63% of the total variance. The plot “Partial axes”
(Fig. 6.18) represents the projection of the principal components of each separate
PCA on the global PCA.
The plot “Individual factor map” (Fig. 6.19) shows the positions of the sites
according to four viewpoints: the labelled black points represent the MFA site scores
(centroids of the site scores of the three separate PCAs); they are connected by
coloured lines to the points representing their scores in the three separate PCAs.
The plot “Correlation circle” (Fig. 6.20) represents the normalized vectors of all
quantitative variables.
If we examine Figs. 6.19 and 6.20 together, we can recognize the main upstreamdownstream gradient along the first axis and the gradient of water quality along a
combination of the first and second axes (from upper left to lower right). For
example, the scores of sites 1, 2 and 3 (Fig. 6.19, left-hand part of the graph)
correspond (Fig. 6.20) to high elevation and strong slope, as well as high oxygen
-1.0
-0.5
0.0
0.5
1.0
-1.0
-0.5
0.0
0.5
1.0
Partial axes
Dim 1 (47.70%)
Dim 2 (15.74%)
Dim1.Fish community
Dim2.Fish community
Dim1.Physiography
Dim2.Physiography
Dim1.Water quality
Dim2.Water quality
Dim1.Fish community
Dim2.Fish community
Dim1.Physiography
Dim2.Physiography
Dim1.Water quality
Dim2.Water quality
Dim1.Fish community
Dim2.Fish community
Dim1.Physiography
Dim2.Physiography
Dim1.Water quality
Dim2.Water quality
Dim1.Fish community
Dim2.Fish community
Dim1.Physiography
Dim2.Physiography
Dim1.Water quality
Dim2.Water quality
Dim1.Fish community
Dim2.Fish community
Dim1.Physiography
Dim2.Physiography
Dim1.Water quality
Dim2.Water quality
Dim1.Fish community
Dim2.Fish community
Dim1.Physiography
Dim2.Physiography
Dim1.Water quality
Dim2.Water quality
Dim1.Fish community
Dim2.Fish community
Dim1.Physiography
Dim2.Physiography
Dim1.Water quality
Dim2.Water quality
Dim1.Fish community
Dim2.Fish community
Dim1.Physiography
Dim2.Physiography
Dim1.Water quality
Dim2.Water quality
Dim1.Fish community
Dim2.Fish community
Dim1.Physiography
Dim2.Physiography
Dim1.Water quality
Dim2.Water quality
Fish community
Physiography
Water quality
Fig. 6.18 Projection of the PCA axes of each subset on the MFA plane 1 Â 2. The circle of radius
1 represents the maximum length of a partial standardized axis
6.10 Multiple Factor Analysis (MFA)
285