

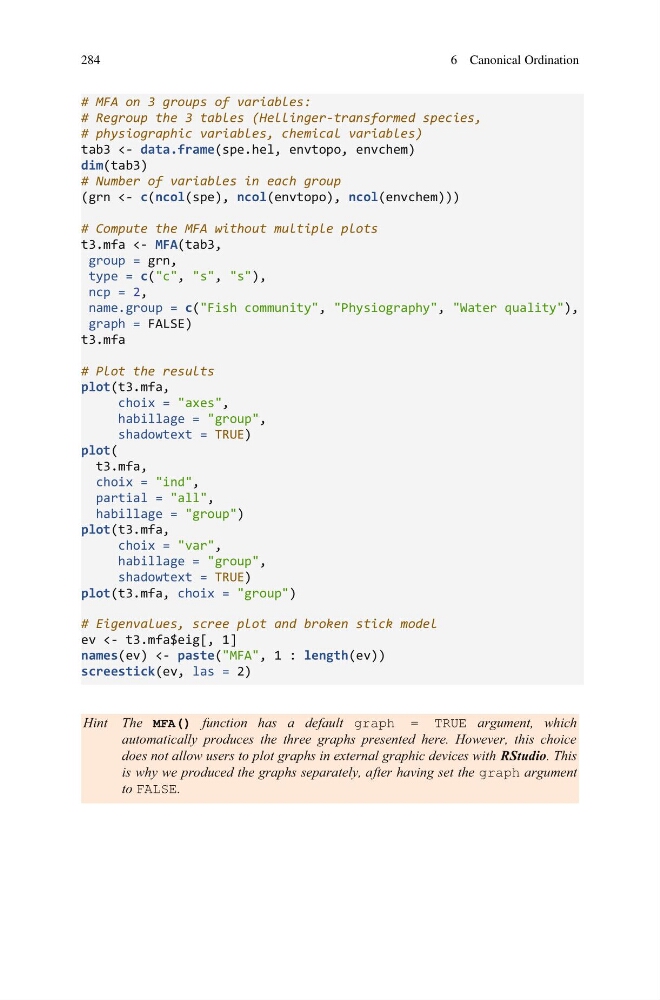
# MFA on 3 groups of variables:
# Regroup the 3 tables (Hellinger-transformed species,
# physiographic variables, chemical variables)
tab3 <- data.frame(spe.hel, envtopo, envchem)
dim(tab3)
# Number of variables in each group
(grn <- c(ncol(spe), ncol(envtopo), ncol(envchem)))
# Compute the MFA without multiple plots
t3.mfa <- MFA(tab3,
group = grn,
type = c("c", "s", "s"),
ncp = 2,
name.group = c("Fish community", "Physiography", "Water quality"),
graph = FALSE)
t3.mfa
# Plot the results
plot(t3.mfa,
choix = "axes",
habillage = "group",
shadowtext = TRUE)
plot(
t3.mfa,
choix = "ind",
partial = "all",
habillage = "group")
plot(t3.mfa,
choix = "var",
habillage = "group",
shadowtext = TRUE)
plot(t3.mfa, choix = "group")
# Eigenvalues, scree plot and broken stick model
ev <- t3.mfa$eig[, 1]
names(ev) <- paste("MFA", 1 : length(ev))
screestick(ev, las = 2)
Hint The MFA() function has a default graph = TRUE argument, which
automatically produces the three graphs presented here. However, this choice
does not allow users to plot graphs in external graphic devices with RStudio. This
is why we produced the graphs separately, after having set the graph argument
to FALSE.
284
6 Canonical Ordination
# Regroup the 3 tables (Hellinger-transformed species,
# physiographic variables, chemical variables)
tab3 <- data.frame(spe.hel, envtopo, envchem)
dim(tab3)
# Number of variables in each group
(grn <- c(ncol(spe), ncol(envtopo), ncol(envchem)))
# Compute the MFA without multiple plots
t3.mfa <- MFA(tab3,
group = grn,
type = c("c", "s", "s"),
ncp = 2,
name.group = c("Fish community", "Physiography", "Water quality"),
graph = FALSE)
t3.mfa
# Plot the results
plot(t3.mfa,
choix = "axes",
habillage = "group",
shadowtext = TRUE)
plot(
t3.mfa,
choix = "ind",
partial = "all",
habillage = "group")
plot(t3.mfa,
choix = "var",
habillage = "group",
shadowtext = TRUE)
plot(t3.mfa, choix = "group")
# Eigenvalues, scree plot and broken stick model
ev <- t3.mfa$eig[, 1]
names(ev) <- paste("MFA", 1 : length(ev))
screestick(ev, las = 2)
Hint The MFA() function has a default graph = TRUE argument, which
automatically produces the three graphs presented here. However, this choice
does not allow users to plot graphs in external graphic devices with RStudio. This
is why we produced the graphs separately, after having set the graph argument
to FALSE.
284
6 Canonical Ordination