

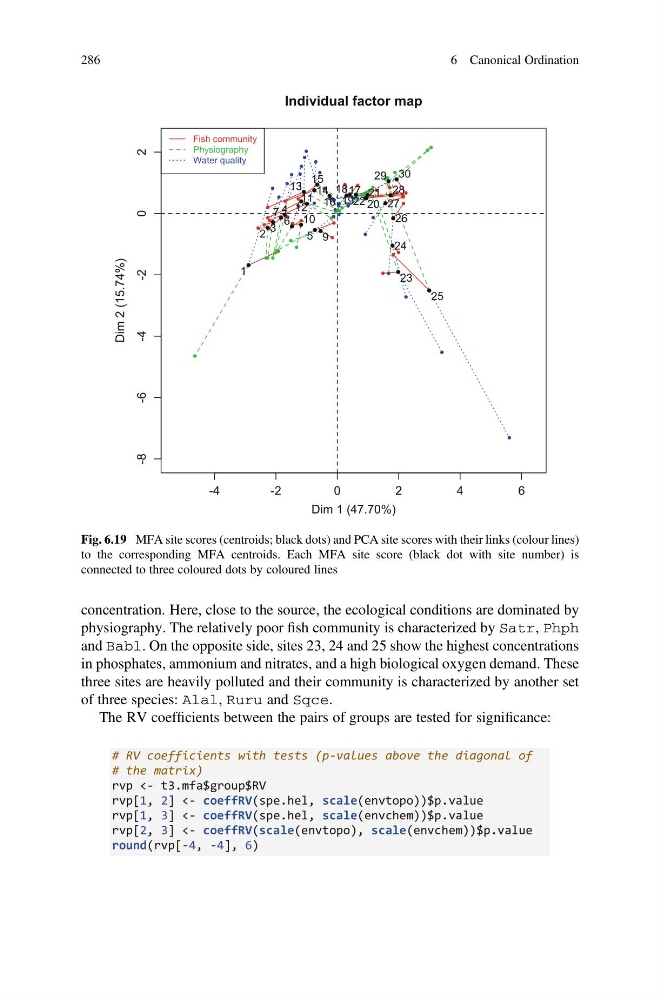
concentration. Here, close to the source, the ecological conditions are dominated by
physiography. The relatively poor fish community is characterized by Satr, Phph
and Babl. On the opposite side, sites 23, 24 and 25 show the highest concentrations
in phosphates, ammonium and nitrates, and a high biological oxygen demand. These
three sites are heavily polluted and their community is characterized by another set
of three species: Alal, Ruru and Sqce.
The RV coefficients between the pairs of groups are tested for significance:
# RV coefficients with tests (p-values above the diagonal of
# the matrix)
rvp <- t3.mfa$group$RV
rvp[1, 2] <- coeffRV(spe.hel, scale(envtopo))$p.value
rvp[1, 3] <- coeffRV(spe.hel, scale(envchem))$p.value
rvp[2, 3] <- coeffRV(scale(envtopo), scale(envchem))$p.value
round(rvp[-4, -4], 6)
-4
-2
0
2
4
6
-8
-6
-4
-2
0
2
Individual factor map
Dim 1 (47.70%)
Dim 2 (15.74%)
1
2
3
4
5
6
7
9
10
11
12
13 14
15
16
17
18
19 20
21
22
23
24
25
26
27
28
29 30
Fish community
Physiography
Water quality
Fig. 6.19 MFA site scores (centroids; black dots) and PCA site scores with their links (colour lines)
to the corresponding MFA centroids. Each MFA site score (black dot with site number) is
connected to three coloured dots by coloured lines
286
6 Canonical Ordination
physiography. The relatively poor fish community is characterized by Satr, Phph
and Babl. On the opposite side, sites 23, 24 and 25 show the highest concentrations
in phosphates, ammonium and nitrates, and a high biological oxygen demand. These
three sites are heavily polluted and their community is characterized by another set
of three species: Alal, Ruru and Sqce.
The RV coefficients between the pairs of groups are tested for significance:
# RV coefficients with tests (p-values above the diagonal of
# the matrix)
rvp <- t3.mfa$group$RV
rvp[1, 2] <- coeffRV(spe.hel, scale(envtopo))$p.value
rvp[1, 3] <- coeffRV(spe.hel, scale(envchem))$p.value
rvp[2, 3] <- coeffRV(scale(envtopo), scale(envchem))$p.value
round(rvp[-4, -4], 6)
-4
-2
0
2
4
6
-8
-6
-4
-2
0
2
Individual factor map
Dim 1 (47.70%)
Dim 2 (15.74%)
1
2
3
4
5
6
7
9
10
11
12
13 14
15
16
17
18
19 20
21
22
23
24
25
26
27
28
29 30
Fish community
Physiography
Water quality
Fig. 6.19 MFA site scores (centroids; black dots) and PCA site scores with their links (colour lines)
to the corresponding MFA centroids. Each MFA site score (black dot with site number) is
connected to three coloured dots by coloured lines
286
6 Canonical Ordination