

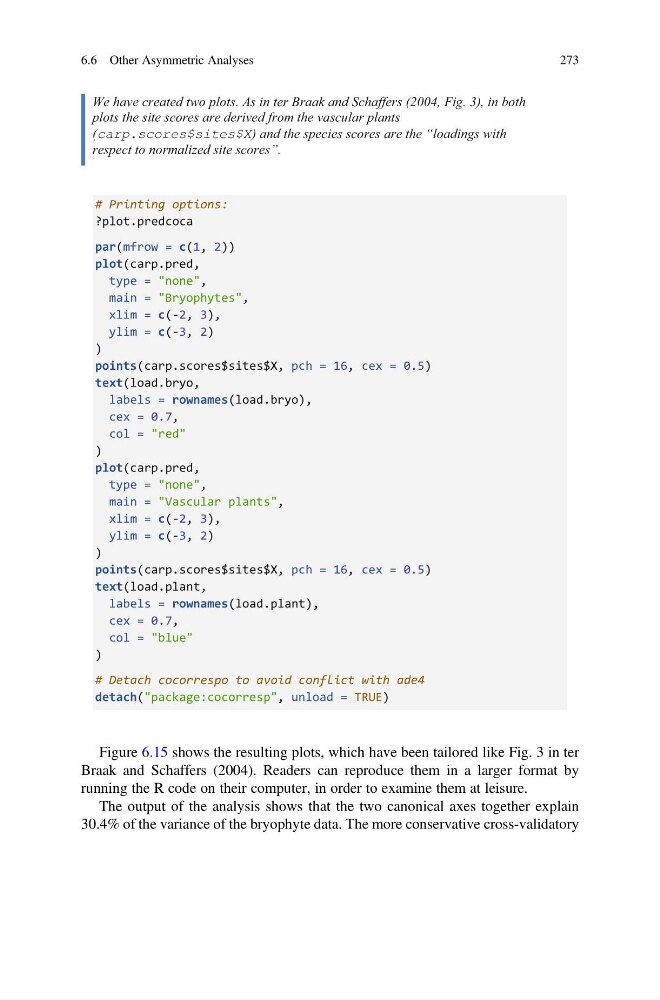
We have created two plots. As in ter Braak and Schaffers (2004, Fig. 3), in both
plots the site scores are derived from the vascular plants
(carp.scores$sites$X) and the species scores are the “loadings with
respect to normalized site scores”.
# Printing options:
?plot.predcoca
par(mfrow = c(1, 2))
plot(carp.pred,
type = "none",
main = "Bryophytes",
xlim = c(-2, 3),
ylim = c(-3, 2)
)
points(carp.scores$sites$X, pch = 16, cex = 0.5)
text(load.bryo,
labels = rownames(load.bryo),
cex = 0.7,
col = "red"
)
plot(carp.pred,
type = "none",
main = "Vascular plants",
xlim = c(-2, 3),
ylim = c(-3, 2)
)
points(carp.scores$sites$X, pch = 16, cex = 0.5)
text(load.plant,
labels = rownames(load.plant),
cex = 0.7,
col = "blue"
)
# Detach cocorrespo to avoid conflict with ade4
detach("package:cocorresp", unload = TRUE)
Figure 6.15 shows the resulting plots, which have been tailored like Fig. 3 in ter
Braak and Schaffers (2004). Readers can reproduce them in a larger format by
running the R code on their computer, in order to examine them at leisure.
The output of the analysis shows that the two canonical axes together explain
30.4% of the variance of the bryophyte data. The more conservative cross-validatory
6.6 Other Asymmetric Analyses
273
plots the site scores are derived from the vascular plants
(carp.scores$sites$X) and the species scores are the “loadings with
respect to normalized site scores”.
# Printing options:
?plot.predcoca
par(mfrow = c(1, 2))
plot(carp.pred,
type = "none",
main = "Bryophytes",
xlim = c(-2, 3),
ylim = c(-3, 2)
)
points(carp.scores$sites$X, pch = 16, cex = 0.5)
text(load.bryo,
labels = rownames(load.bryo),
cex = 0.7,
col = "red"
)
plot(carp.pred,
type = "none",
main = "Vascular plants",
xlim = c(-2, 3),
ylim = c(-3, 2)
)
points(carp.scores$sites$X, pch = 16, cex = 0.5)
text(load.plant,
labels = rownames(load.plant),
cex = 0.7,
col = "blue"
)
# Detach cocorrespo to avoid conflict with ade4
detach("package:cocorresp", unload = TRUE)
Figure 6.15 shows the resulting plots, which have been tailored like Fig. 3 in ter
Braak and Schaffers (2004). Readers can reproduce them in a larger format by
running the R code on their computer, in order to examine them at leisure.
The output of the analysis shows that the two canonical axes together explain
30.4% of the variance of the bryophyte data. The more conservative cross-validatory
6.6 Other Asymmetric Analyses
273