

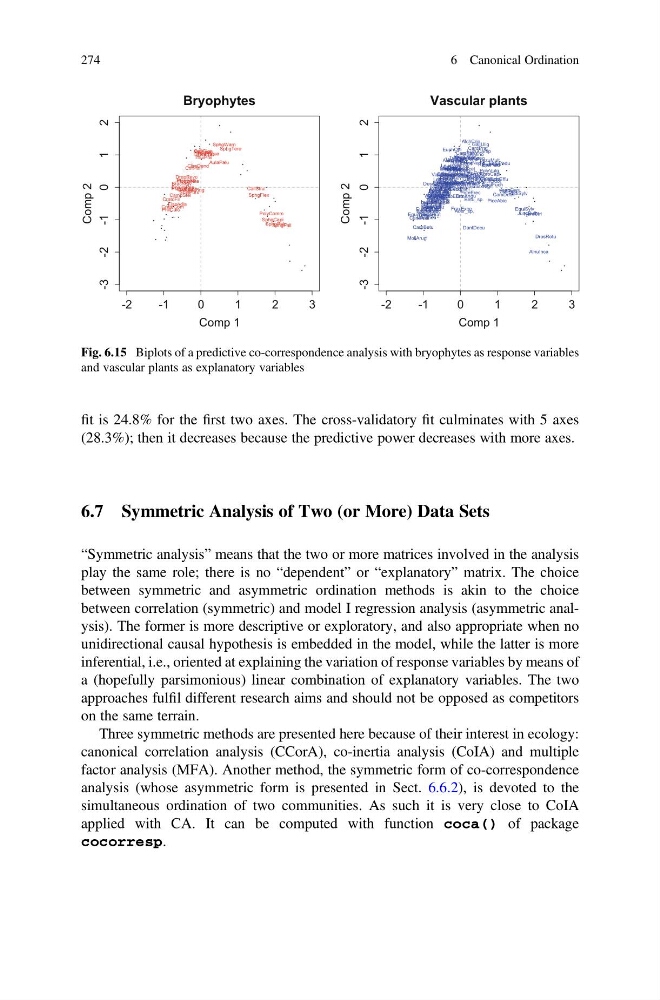
fit is 24.8% for the first two axes. The cross-validatory fit culminates with 5 axes
(28.3%); then it decreases because the predictive power decreases with more axes.
6.7 Symmetric Analysis of Two (or More) Data Sets
“Symmetric analysis” means that the two or more matrices involved in the analysis
play the same role; there is no “dependent” or “explanatory” matrix. The choice
between symmetric and asymmetric ordination methods is akin to the choice
between correlation (symmetric) and model I regression analysis (asymmetric analysis). The former is more descriptive or exploratory, and also appropriate when no
unidirectional causal hypothesis is embedded in the model, while the latter is more
inferential, i.e., oriented at explaining the variation of response variables by means of
a (hopefully parsimonious) linear combination of explanatory variables. The two
approaches fulfil different research aims and should not be opposed as competitors
on the same terrain.
Three symmetric methods are presented here because of their interest in ecology:
canonical correlation analysis (CCorA), co-inertia analysis (CoIA) and multiple
factor analysis (MFA). Another method, the symmetric form of co-correspondence
analysis (whose asymmetric form is presented in Sect. 6.6.2), is devoted to the
simultaneous ordination of two communities. As such it is very close to CoIA
applied with CA. It can be computed with function coca() of package
cocorresp.
- 2
- 1
0
1
2
3
-3
-2
-1
0
1
2
Bryophytes
Comp 1
Comp 2
AneuPing
AulaPalu
BrachRiv
BryumPse CallCusp
CallGiga
CallStra
CampStel
CirrPili ClimDend
CratoCom
CratoFil
DrepRevo
FissAdia
HomaNite
HypnPrat
PhilCalc
PhilFont
PlagElat
PlagUndu
PolyComm
RhytSqua
SclePuru
SphgCapi
SphgFall
SphgFlex
SphgTere
SphgPalu
SphgWarn
ThuiPhil
-2
-1
0
1
2
3
-3
-2
-1
0
1
2
Vascular plants
Comp 1
Comp 2
Acer_sp.
AchiMill
AgroCani
AgroCapi
AgroStol
AjugRept
AlchCrin
AlchGlab AlchVulg
AlnuGlut
AlnuInca
AnemNemo
AngeSylv
AnthOdor
Betu_sp.
BlysComp
BrizMedi
BromErec
CalaEpig
CaltPalu
CardAmar
CardPrat
CarpBetu
CarxDemi
CarxDist
CarxEchi
CarxFlac
CarxFlav
CarxHirt
CarxNigr
CarxPall
CarxPani
CarxPncl
CarxTome
CentJace
CirsPalu
CirsRivu ColchAut
CrepPalu
CrucGlab
DactFuch
DactGlom
DactInca
DactMaja
DantDecu
DeschCes
DrosRotu
EleoQUin
EpilPalu
EpilParv
EpipPalu
EquiArve
EquiFluv
EquiPalu
EquiSylv
EquiTelm
ErioAngu
ErioLati
EupaCann
EuphOffi
FestPrat
FestRubr
FiliUlma
FraxExce
GaliAlbu
GaliPalu
GaliUlig
GymnCono
HolcLana
HypeMacu
HypeTetr
JuncArti
JuncBulb
JuncCong
JuncEffu
JuncInfl
LathPrat
LeonHisp
LeucVulg
LinuCath ListOvat
LotuCorn
LotuPedu
LuzuCamp
LuzuMult
LychFlos
LycoEuro
LysiNemo
LysiNumm
LysiVulg
LythSali
MentArve
MentLong
MoliArun
MyosNemo
NardStri
ParnPalu
PediSylv
PiceAbie
PlanLanc
PoaTriv
PolyAmar
PolyVulg
PoteErec
PrimElat PrunVulg
RanuAcri
RanuFlam
RanuRepe
RhinMino
RumxAcet
SalxCine
SangOffi
ScirSylv
SuccPrat
Tarx_Pal
TrifPrat
TrigPalu
TussFarf
ValeDioi
ValeSimp
ViciCrac
ViolPalu
Fig. 6.15 Biplots of a predictive co-correspondence analysis with bryophytes as response variables
and vascular plants as explanatory variables
274
6 Canonical Ordination
(28.3%); then it decreases because the predictive power decreases with more axes.
6.7 Symmetric Analysis of Two (or More) Data Sets
“Symmetric analysis” means that the two or more matrices involved in the analysis
play the same role; there is no “dependent” or “explanatory” matrix. The choice
between symmetric and asymmetric ordination methods is akin to the choice
between correlation (symmetric) and model I regression analysis (asymmetric analysis). The former is more descriptive or exploratory, and also appropriate when no
unidirectional causal hypothesis is embedded in the model, while the latter is more
inferential, i.e., oriented at explaining the variation of response variables by means of
a (hopefully parsimonious) linear combination of explanatory variables. The two
approaches fulfil different research aims and should not be opposed as competitors
on the same terrain.
Three symmetric methods are presented here because of their interest in ecology:
canonical correlation analysis (CCorA), co-inertia analysis (CoIA) and multiple
factor analysis (MFA). Another method, the symmetric form of co-correspondence
analysis (whose asymmetric form is presented in Sect. 6.6.2), is devoted to the
simultaneous ordination of two communities. As such it is very close to CoIA
applied with CA. It can be computed with function coca() of package
cocorresp.
- 2
- 1
0
1
2
3
-3
-2
-1
0
1
2
Bryophytes
Comp 1
Comp 2
AneuPing
AulaPalu
BrachRiv
BryumPse CallCusp
CallGiga
CallStra
CampStel
CirrPili ClimDend
CratoCom
CratoFil
DrepRevo
FissAdia
HomaNite
HypnPrat
PhilCalc
PhilFont
PlagElat
PlagUndu
PolyComm
RhytSqua
SclePuru
SphgCapi
SphgFall
SphgFlex
SphgTere
SphgPalu
SphgWarn
ThuiPhil
-2
-1
0
1
2
3
-3
-2
-1
0
1
2
Vascular plants
Comp 1
Comp 2
Acer_sp.
AchiMill
AgroCani
AgroCapi
AgroStol
AjugRept
AlchCrin
AlchGlab AlchVulg
AlnuGlut
AlnuInca
AnemNemo
AngeSylv
AnthOdor
Betu_sp.
BlysComp
BrizMedi
BromErec
CalaEpig
CaltPalu
CardAmar
CardPrat
CarpBetu
CarxDemi
CarxDist
CarxEchi
CarxFlac
CarxFlav
CarxHirt
CarxNigr
CarxPall
CarxPani
CarxPncl
CarxTome
CentJace
CirsPalu
CirsRivu ColchAut
CrepPalu
CrucGlab
DactFuch
DactGlom
DactInca
DactMaja
DantDecu
DeschCes
DrosRotu
EleoQUin
EpilPalu
EpilParv
EpipPalu
EquiArve
EquiFluv
EquiPalu
EquiSylv
EquiTelm
ErioAngu
ErioLati
EupaCann
EuphOffi
FestPrat
FestRubr
FiliUlma
FraxExce
GaliAlbu
GaliPalu
GaliUlig
GymnCono
HolcLana
HypeMacu
HypeTetr
JuncArti
JuncBulb
JuncCong
JuncEffu
JuncInfl
LathPrat
LeonHisp
LeucVulg
LinuCath ListOvat
LotuCorn
LotuPedu
LuzuCamp
LuzuMult
LychFlos
LycoEuro
LysiNemo
LysiNumm
LysiVulg
LythSali
MentArve
MentLong
MoliArun
MyosNemo
NardStri
ParnPalu
PediSylv
PiceAbie
PlanLanc
PoaTriv
PolyAmar
PolyVulg
PoteErec
PrimElat PrunVulg
RanuAcri
RanuFlam
RanuRepe
RhinMino
RumxAcet
SalxCine
SangOffi
ScirSylv
SuccPrat
Tarx_Pal
TrifPrat
TrigPalu
TussFarf
ValeDioi
ValeSimp
ViciCrac
ViolPalu
Fig. 6.15 Biplots of a predictive co-correspondence analysis with bryophytes as response variables
and vascular plants as explanatory variables
274
6 Canonical Ordination