

species abundances will make sense. The maximum value, 5, corresponds to the
class with the maximum number of individuals captured by electrical fishing in the
Doubs River and its tributaries (i.e. not only in this data set) by Verneaux. Therefore,
species-specific codes cannot be understood as unbiased estimates of the true
abundances (number or density of individuals) or biomasses at the sites.
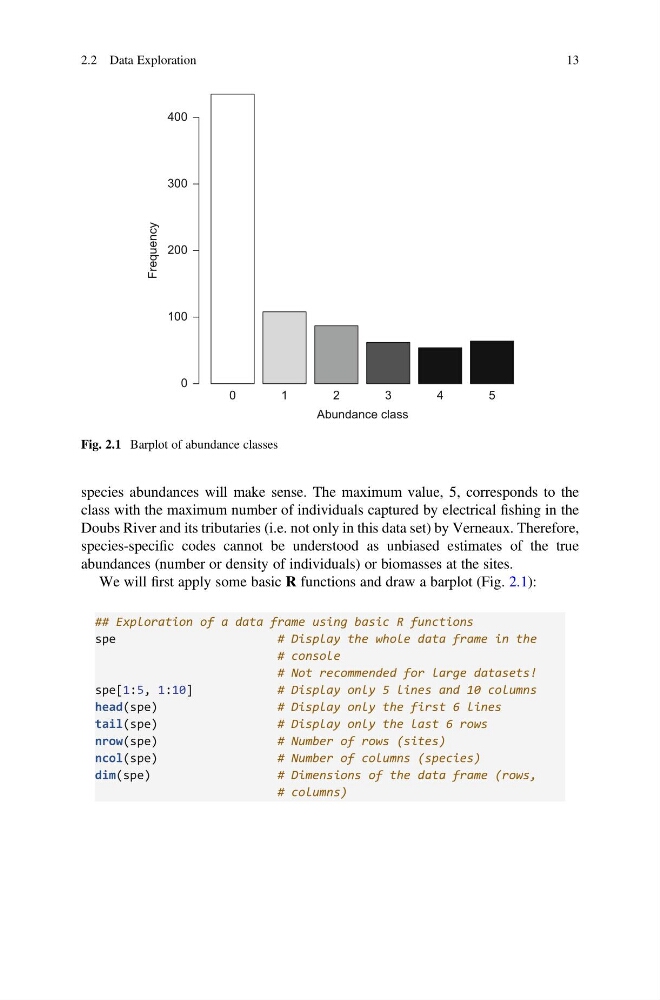
We will first apply some basic R functions and draw a barplot (Fig. 2.1):
## Exploration of a data frame using basic R functions
spe
# Display the whole data frame in the
# console
# Not recommended for large datasets!
spe[1:5, 1:10]
# Display only 5 lines and 10 columns
head(spe)
# Display only the first 6 lines
tail(spe)
# Display only the last 6 rows
nrow(spe)
# Number of rows (sites)
ncol(spe)
# Number of columns (species)
dim(spe)
# Dimensions of the data frame (rows,
# columns)
0
1
2
3
4
5
Abundance class
Frequency
0
100
200
300
400
Fig. 2.1 Barplot of abundance classes
2.2 Data Exploration
13
class with the maximum number of individuals captured by electrical fishing in the
Doubs River and its tributaries (i.e. not only in this data set) by Verneaux. Therefore,
species-specific codes cannot be understood as unbiased estimates of the true
abundances (number or density of individuals) or biomasses at the sites.
We will first apply some basic R functions and draw a barplot (Fig. 2.1):
## Exploration of a data frame using basic R functions
spe
# Display the whole data frame in the
# console
# Not recommended for large datasets!
spe[1:5, 1:10]
# Display only 5 lines and 10 columns
head(spe)
# Display only the first 6 lines
tail(spe)
# Display only the last 6 rows
nrow(spe)
# Number of rows (sites)
ncol(spe)
# Number of columns (species)
dim(spe)
# Dimensions of the data frame (rows,
# columns)
0
1
2
3
4
5
Abundance class
Frequency
0
100
200
300
400
Fig. 2.1 Barplot of abundance classes
2.2 Data Exploration
13