

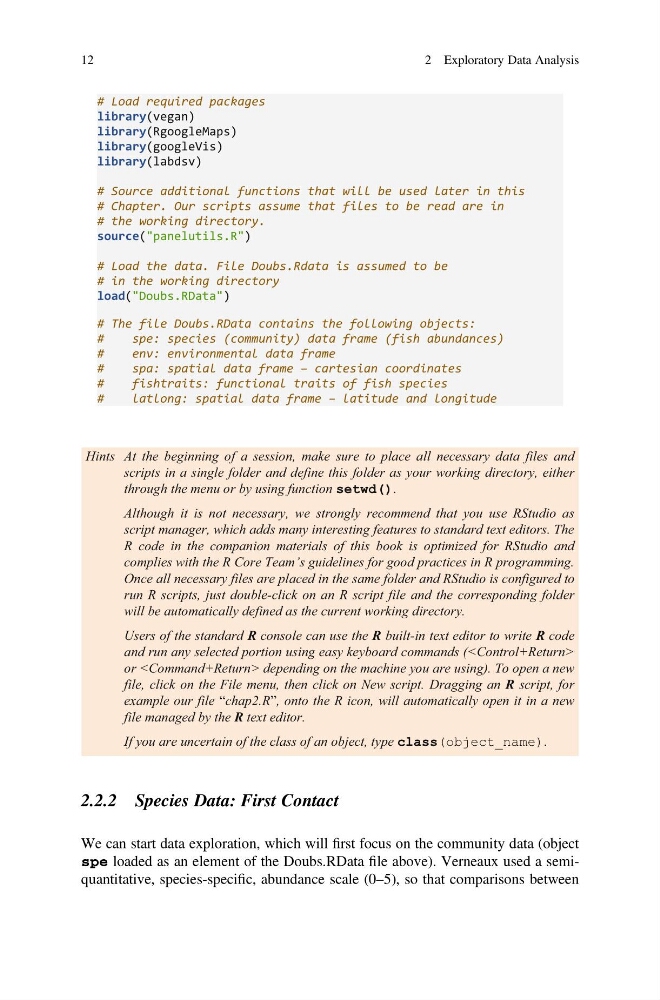
# Load required packages
library(vegan)
library(RgoogleMaps)
library(googleVis)
library(labdsv)
# Source additional functions that will be used later in this
# Chapter. Our scripts assume that files to be read are in
# the working directory.
source("panelutils.R")
# Load the data. File Doubs.Rdata is assumed to be
# in the working directory
load("Doubs.RData")
# The file Doubs.RData contains the following objects:
#
spe: species (community) data frame (fish abundances)
#
env: environmental data frame
#
spa: spatial data frame – cartesian coordinates
#
fishtraits: functional traits of fish species
#
latlong: spatial data frame – latitude and longitude
Hints At the beginning of a session, make sure to place all necessary data files and
scripts in a single folder and define this folder as your working directory, either
through the menu or by using function setwd().
Although it is not necessary, we strongly recommend that you use RStudio as
script manager, which adds many interesting features to standard text editors. The
R code in the companion materials of this book is optimized for RStudio and
complies with the R Core Team’s guidelines for good practices in R programming.
Once all necessary files are placed in the same folder and RStudio is configured to
run R scripts, just double-click on an R script file and the corresponding folder
will be automatically defined as the current working directory.
Users of the standard R console can use the R built-in text editor to write R code
and run any selected portion using easy keyboard commands (
or depending on the machine you are using). To open a new
file, click on the File menu, then click on New script. Dragging an R script, for
example our file “chap2.R”, onto the R icon, will automatically open it in a new
file managed by the R text editor.
If you are uncertain of the class of an object, type class(object_name).
2.2.2 Species Data: First Contact
We can start data exploration, which will first focus on the community data (object
spe loaded as an element of the Doubs.RData file above). Verneaux used a semiquantitative, species-specific, abundance scale (0–5), so that comparisons between
12
2 Exploratory Data Analysis
library(vegan)
library(RgoogleMaps)
library(googleVis)
library(labdsv)
# Source additional functions that will be used later in this
# Chapter. Our scripts assume that files to be read are in
# the working directory.
source("panelutils.R")
# Load the data. File Doubs.Rdata is assumed to be
# in the working directory
load("Doubs.RData")
# The file Doubs.RData contains the following objects:
#
spe: species (community) data frame (fish abundances)
#
env: environmental data frame
#
spa: spatial data frame – cartesian coordinates
#
fishtraits: functional traits of fish species
#
latlong: spatial data frame – latitude and longitude
Hints At the beginning of a session, make sure to place all necessary data files and
scripts in a single folder and define this folder as your working directory, either
through the menu or by using function setwd().
Although it is not necessary, we strongly recommend that you use RStudio as
script manager, which adds many interesting features to standard text editors. The
R code in the companion materials of this book is optimized for RStudio and
complies with the R Core Team’s guidelines for good practices in R programming.
Once all necessary files are placed in the same folder and RStudio is configured to
run R scripts, just double-click on an R script file and the corresponding folder
will be automatically defined as the current working directory.
Users of the standard R console can use the R built-in text editor to write R code
and run any selected portion using easy keyboard commands (
or
file, click on the File menu, then click on New script. Dragging an R script, for
example our file “chap2.R”, onto the R icon, will automatically open it in a new
file managed by the R text editor.
If you are uncertain of the class of an object, type class(object_name).
2.2.2 Species Data: First Contact
We can start data exploration, which will first focus on the community data (object
spe loaded as an element of the Doubs.RData file above). Verneaux used a semiquantitative, species-specific, abundance scale (0–5), so that comparisons between
12
2 Exploratory Data Analysis