

# Plot the fuzzy clusters on a map of the Doubs River
plot(
spa,
asp = 1,
type = "n",
main = "Fuzzy clusters along the river",
xlab = "x coordinate (km)",
ylab = "y coordinate (km)"
)
lines(spa, col = "light blue")
text(65, 20, "Upstream", cex = 1.2)
text(15, 32, "Downstream", cex = 1.2)
# Add sectors to represent fuzzy membership
for (i in 1:k) {
stars(
spe.fuz$membership,
location = spa,
key.loc = c(150, 20),
key.labels = 1:k,
draw.segments = TRUE,
add = TRUE,
len = 5,
col.segments = 2:(k + 1)
)
}
0
5 0
1 0 0
1 5 0
20
40
60
80
100
Fuzzy clusters along the river
x coordinate (km)
y coordinate (km)
Upstream
Downstream
1
2
3
4
5
6
7
9
10
11
12
13
14
15
16
17
18
19
20
21
22
23
24
25
26
27
28
29
30
1
2
3
4
1
2
3
4
5
6
7
9
10
11
12
13
14
15
16
17
18
19
20
21
22
23
24
25
26
27
28
29
30
1
2
3
4
1
2
3
4
5
6
7
9
10
11
12
13
14
15
16
17
18
19
20
21
22
23
24
25
26
27
28
29
30
1
2
3
4
1
2
3
4
5
6
7
9
10
11
12
13
14
15
16
17
18
19
20
21
22
23
24
25
26
27
28
29
30
1
2
3
4
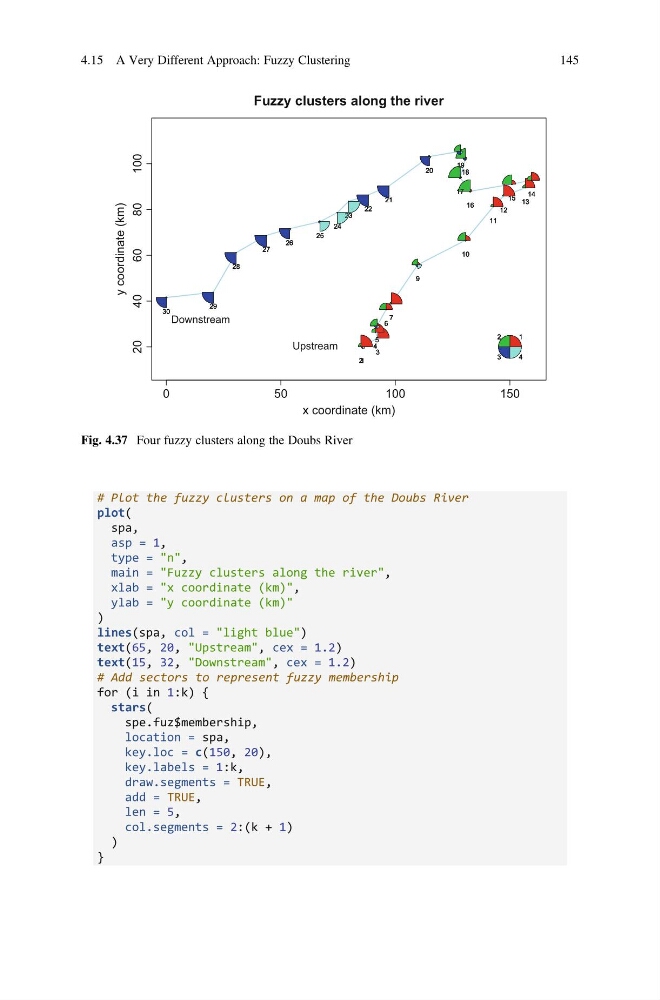
Fig. 4.37 Four fuzzy clusters along the Doubs River
4.15 A Very Different Approach: Fuzzy Clustering
145
plot(
spa,
asp = 1,
type = "n",
main = "Fuzzy clusters along the river",
xlab = "x coordinate (km)",
ylab = "y coordinate (km)"
)
lines(spa, col = "light blue")
text(65, 20, "Upstream", cex = 1.2)
text(15, 32, "Downstream", cex = 1.2)
# Add sectors to represent fuzzy membership
for (i in 1:k) {
stars(
spe.fuz$membership,
location = spa,
key.loc = c(150, 20),
key.labels = 1:k,
draw.segments = TRUE,
add = TRUE,
len = 5,
col.segments = 2:(k + 1)
)
}
0
5 0
1 0 0
1 5 0
20
40
60
80
100
Fuzzy clusters along the river
x coordinate (km)
y coordinate (km)
Upstream
Downstream
1
2
3
4
5
6
7
9
10
11
12
13
14
15
16
17
18
19
20
21
22
23
24
25
26
27
28
29
30
1
2
3
4
1
2
3
4
5
6
7
9
10
11
12
13
14
15
16
17
18
19
20
21
22
23
24
25
26
27
28
29
30
1
2
3
4
1
2
3
4
5
6
7
9
10
11
12
13
14
15
16
17
18
19
20
21
22
23
24
25
26
27
28
29
30
1
2
3
4
1
2
3
4
5
6
7
9
10
11
12
13
14
15
16
17
18
19
20
21
22
23
24
25
26
27
28
29
30
1
2
3
4
Fig. 4.37 Four fuzzy clusters along the Doubs River
4.15 A Very Different Approach: Fuzzy Clustering
145