

4.15.2 Noise Clustering Using the vegclust() Function
A recent package called vegclust, developed by Miquel De Cáceres, provides a
large range of options to perform non-hierarchical or hierarchical fuzzy clustering of
community data under different models (De Cáceres et al. 2010). An interesting one
is called “noise clustering” (Davé and Krishnapuram 1997). It allows the consideration of outliers, i.e. unclassified objects, denoted “N”, beside fuzzy clusters labelled
“M1”, “M2”. . . The principle of the method consists in defining a cluster called
“Noise” in addition to the regular clusters. This “Noise” cluster is represented by an
imaginary point located at a constant distance δ from all observations. The effect of
this cluster is to capture the “objects that lie farther than δ from all the c “good”
centroids” (De Cáceres et al. 2010). A small δ results in a large membership in the
“Noise” cluster.
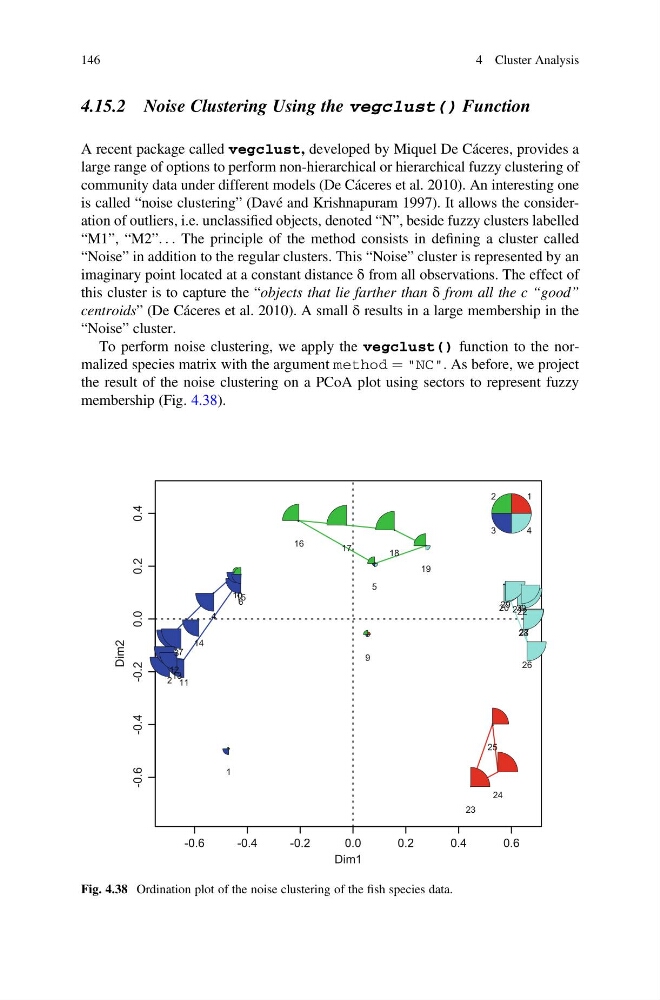
To perform noise clustering, we apply the vegclust() function to the normalized species matrix with the argument method ¼ "NC". As before, we project
the result of the noise clustering on a PCoA plot using sectors to represent fuzzy
membership (Fig. 4.38).
-0.6
-0.4
-0.2
0.0
0.2
0.4
0.6
-0.6
-0.4
-0.2
0.0
0.2
0.4
Dim1
Dim2
1
2
3
4
5
6
7
9
10
11
12
13
14
15
16
17
18
19
20 21 22
23
24
25
26
27
28
29 30
1
2
3
4
Fig. 4.38 Ordination plot of the noise clustering of the fish species data.
146
4 Cluster Analysis
A recent package called vegclust, developed by Miquel De Cáceres, provides a
large range of options to perform non-hierarchical or hierarchical fuzzy clustering of
community data under different models (De Cáceres et al. 2010). An interesting one
is called “noise clustering” (Davé and Krishnapuram 1997). It allows the consideration of outliers, i.e. unclassified objects, denoted “N”, beside fuzzy clusters labelled
“M1”, “M2”. . . The principle of the method consists in defining a cluster called
“Noise” in addition to the regular clusters. This “Noise” cluster is represented by an
imaginary point located at a constant distance δ from all observations. The effect of
this cluster is to capture the “objects that lie farther than δ from all the c “good”
centroids” (De Cáceres et al. 2010). A small δ results in a large membership in the
“Noise” cluster.
To perform noise clustering, we apply the vegclust() function to the normalized species matrix with the argument method ¼ "NC". As before, we project
the result of the noise clustering on a PCoA plot using sectors to represent fuzzy
membership (Fig. 4.38).
-0.6
-0.4
-0.2
0.0
0.2
0.4
0.6
-0.6
-0.4
-0.2
0.0
0.2
0.4
Dim1
Dim2
1
2
3
4
5
6
7
9
10
11
12
13
14
15
16
17
18
19
20 21 22
23
24
25
26
27
28
29 30
1
2
3
4
Fig. 4.38 Ordination plot of the noise clustering of the fish species data.
146
4 Cluster Analysis