

Hints Argument memb.exp is a kind of “fuzziness exponent” with values ranging from
1 (close to non-fuzzy clustering) to any large value.
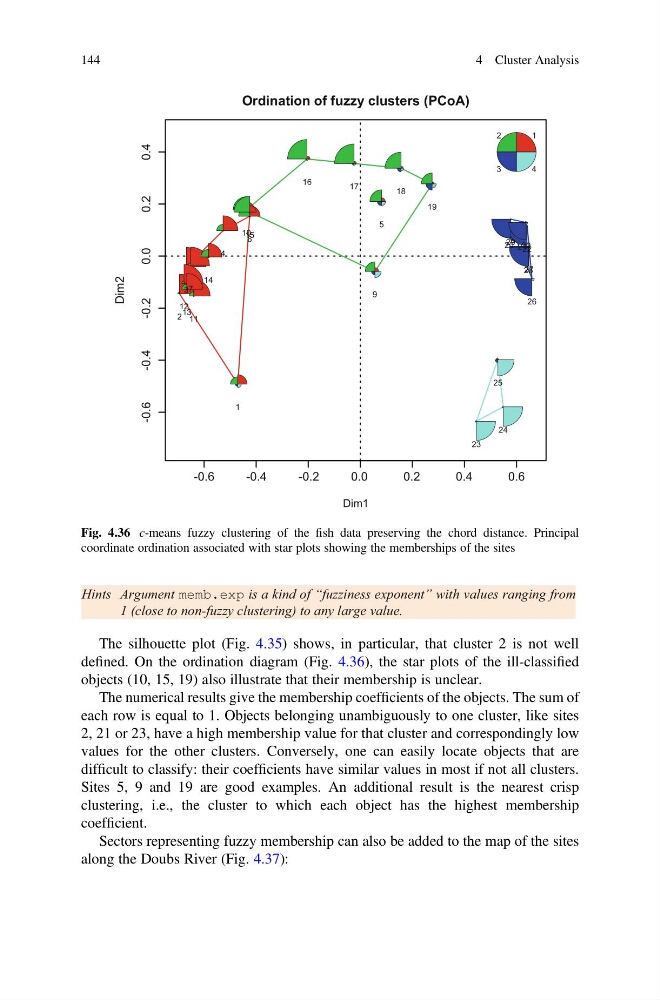
The silhouette plot (Fig. 4.35) shows, in particular, that cluster 2 is not well
defined. On the ordination diagram (Fig. 4.36), the star plots of the ill-classified
objects (10, 15, 19) also illustrate that their membership is unclear.
The numerical results give the membership coefficients of the objects. The sum of
each row is equal to 1. Objects belonging unambiguously to one cluster, like sites
2, 21 or 23, have a high membership value for that cluster and correspondingly low
values for the other clusters. Conversely, one can easily locate objects that are
difficult to classify: their coefficients have similar values in most if not all clusters.
Sites 5, 9 and 19 are good examples. An additional result is the nearest crisp
clustering, i.e., the cluster to which each object has the highest membership
coefficient.
Sectors representing fuzzy membership can also be added to the map of the sites
along the Doubs River (Fig. 4.37):
-0.6
-0.4
-0.2
0.0
0.2
0.4
0.6
-0.6
-0.4
-0.2
0.0
0.2
0.4
Ordination of fuzzy clusters (PCoA)
Dim1
Dim2
1
2
3
4
5
6
7
9
10
11
12
13
14
15
16
17
18
19
20 21 22
23
24
25
26
27
28
29 30
1
2
3
4
Fig. 4.36 c-means fuzzy clustering of the fish data preserving the chord distance. Principal
coordinate ordination associated with star plots showing the memberships of the sites
144
4 Cluster Analysis
1 (close to non-fuzzy clustering) to any large value.
The silhouette plot (Fig. 4.35) shows, in particular, that cluster 2 is not well
defined. On the ordination diagram (Fig. 4.36), the star plots of the ill-classified
objects (10, 15, 19) also illustrate that their membership is unclear.
The numerical results give the membership coefficients of the objects. The sum of
each row is equal to 1. Objects belonging unambiguously to one cluster, like sites
2, 21 or 23, have a high membership value for that cluster and correspondingly low
values for the other clusters. Conversely, one can easily locate objects that are
difficult to classify: their coefficients have similar values in most if not all clusters.
Sites 5, 9 and 19 are good examples. An additional result is the nearest crisp
clustering, i.e., the cluster to which each object has the highest membership
coefficient.
Sectors representing fuzzy membership can also be added to the map of the sites
along the Doubs River (Fig. 4.37):
-0.6
-0.4
-0.2
0.0
0.2
0.4
0.6
-0.6
-0.4
-0.2
0.0
0.2
0.4
Ordination of fuzzy clusters (PCoA)
Dim1
Dim2
1
2
3
4
5
6
7
9
10
11
12
13
14
15
16
17
18
19
20 21 22
23
24
25
26
27
28
29 30
1
2
3
4
Fig. 4.36 c-means fuzzy clustering of the fish data preserving the chord distance. Principal
coordinate ordination associated with star plots showing the memberships of the sites
144
4 Cluster Analysis