

# Cut the dendrogram in 4 clusters
k <- 4
(gr4 <- cutree(spe.chcl, k = k))
# Plot the dendrogram
plot(spe.chcl, hang = -1, main = "CONISS clustering")
rect.hclust(spe.chcl, k = k)
If you want, you can space out the branches of the dendrogram according to the
distance from the source:
# Dendrogram with observations plotted according to dfs
plot(spe.chcl,
xvar = env$dfs,
hang = -1,
main = "CONISS clustering",
cex = 0.8)
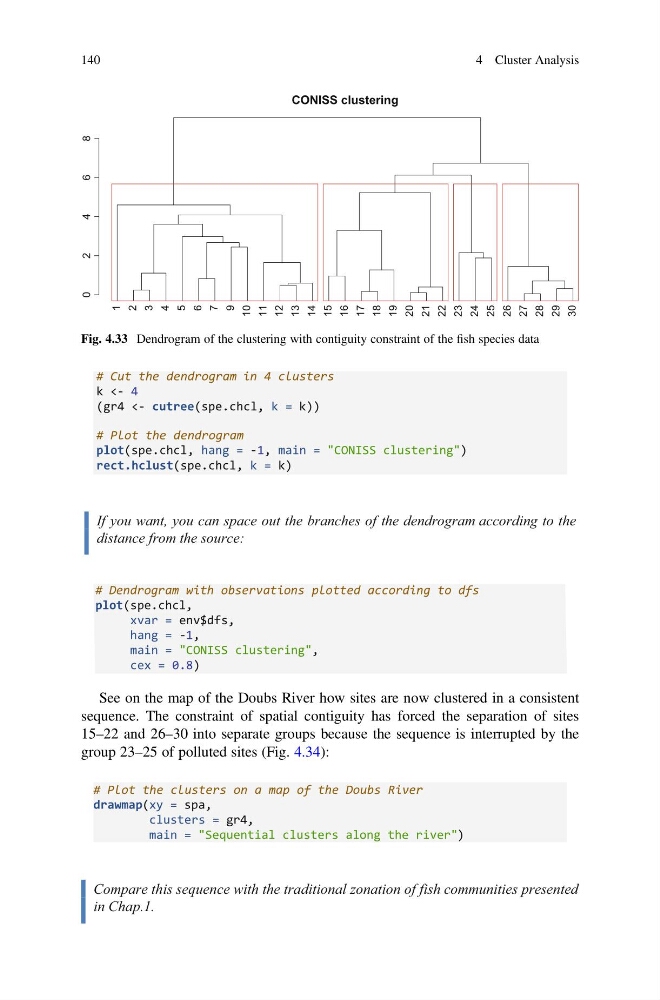
See on the map of the Doubs River how sites are now clustered in a consistent
sequence. The constraint of spatial contiguity has forced the separation of sites
15–22 and 26–30 into separate groups because the sequence is interrupted by the
group 23–25 of polluted sites (Fig. 4.34):
# Plot the clusters on a map of the Doubs River
drawmap(xy = spa,
clusters = gr4,
main = "Sequential clusters along the river")
Compare this sequence with the traditional zonation of fish communities presented
in Chap.1.
CONISS clustering
1
2
3
4
5
6
7
9
10
11
12
13
14
15
16
17
18
19
20
21
22
23
24
25
26
27
28
29
30
0
2
4
6
8
Fig. 4.33 Dendrogram of the clustering with contiguity constraint of the fish species data
140
4 Cluster Analysis
k <- 4
(gr4 <- cutree(spe.chcl, k = k))
# Plot the dendrogram
plot(spe.chcl, hang = -1, main = "CONISS clustering")
rect.hclust(spe.chcl, k = k)
If you want, you can space out the branches of the dendrogram according to the
distance from the source:
# Dendrogram with observations plotted according to dfs
plot(spe.chcl,
xvar = env$dfs,
hang = -1,
main = "CONISS clustering",
cex = 0.8)
See on the map of the Doubs River how sites are now clustered in a consistent
sequence. The constraint of spatial contiguity has forced the separation of sites
15–22 and 26–30 into separate groups because the sequence is interrupted by the
group 23–25 of polluted sites (Fig. 4.34):
# Plot the clusters on a map of the Doubs River
drawmap(xy = spa,
clusters = gr4,
main = "Sequential clusters along the river")
Compare this sequence with the traditional zonation of fish communities presented
in Chap.1.
CONISS clustering
1
2
3
4
5
6
7
9
10
11
12
13
14
15
16
17
18
19
20
21
22
23
24
25
26
27
28
29
30
0
2
4
6
8
Fig. 4.33 Dendrogram of the clustering with contiguity constraint of the fish species data
140
4 Cluster Analysis