

different transformations, for both the explanatory and response data. Here we apply
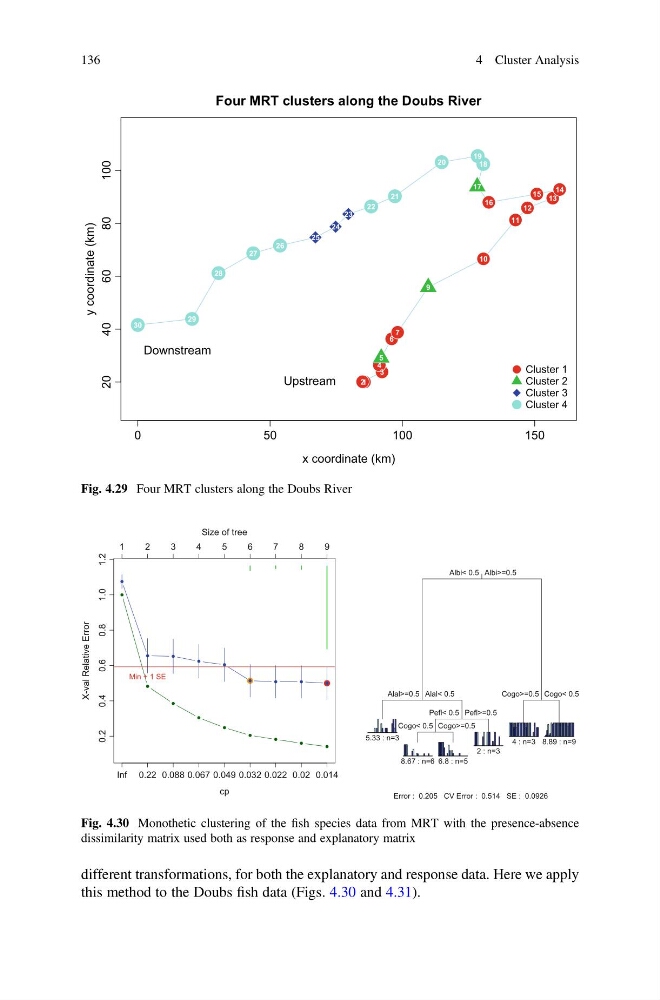
this method to the Doubs fish data (Figs. 4.30 and 4.31).
0
50
100
150
20
40
60
80
100
Four MRT clusters along the Doubs River
x coordinate (km)
y coordinate (km)
Upstream
Downstream
1
2
3
4
5
6
7
9
10
11
12
13
14
15
16
17
18
19
20
21
22
23
24
25
26
27
28
29
30
Cluster 1
Cluster 2
Cluster 3
Cluster 4
Fig. 4.29 Four MRT clusters along the Doubs River
cp
X-val Relative Error
0.2
0.4
0.6
0.8
1.0
1.2
Inf 0.22 0.088 0.067 0.049 0.032 0.022 0.02 0.014
1
2
3
4
5
6
7
8
9
Size of tree
Min + 1 SE
Albi< 0.5
Alal>=0.5
Pefl< 0.5
Cogo< 0.5
Cogo>=0.5
Albi>=0.5
Alal< 0.5
Pefl>=0.5
Cogo>=0.5
Cogo< 0.5
5.33 : n=3
8.67 : n=6 6.8 : n=5
2 : n=3
4 : n=3 8.89 : n=9
Error : 0.205 CV Error : 0.514 SE : 0.0926
Fig. 4.30 Monothetic clustering of the fish species data from MRT with the presence-absence
dissimilarity matrix used both as response and explanatory matrix
136
4 Cluster Analysis
this method to the Doubs fish data (Figs. 4.30 and 4.31).
0
50
100
150
20
40
60
80
100
Four MRT clusters along the Doubs River
x coordinate (km)
y coordinate (km)
Upstream
Downstream
1
2
3
4
5
6
7
9
10
11
12
13
14
15
16
17
18
19
20
21
22
23
24
25
26
27
28
29
30
Cluster 1
Cluster 2
Cluster 3
Cluster 4
Fig. 4.29 Four MRT clusters along the Doubs River
cp
X-val Relative Error
0.2
0.4
0.6
0.8
1.0
1.2
Inf 0.22 0.088 0.067 0.049 0.032 0.022 0.02 0.014
1
2
3
4
5
6
7
8
9
Size of tree
Min + 1 SE
Albi< 0.5
Alal>=0.5
Pefl< 0.5
Cogo< 0.5
Cogo>=0.5
Albi>=0.5
Alal< 0.5
Pefl>=0.5
Cogo>=0.5
Cogo< 0.5
5.33 : n=3
8.67 : n=6 6.8 : n=5
2 : n=3
4 : n=3 8.89 : n=9
Error : 0.205 CV Error : 0.514 SE : 0.0926
Fig. 4.30 Monothetic clustering of the fish species data from MRT with the presence-absence
dissimilarity matrix used both as response and explanatory matrix
136
4 Cluster Analysis