

# Use boxplert() or boxplerk() to plot results with post-hoc tests
with(env, {
boxplerk(
ele,
spech.ward.gk,
xlab = "",
ylab = "ele",
main = "Elevation",
bcol = (1:k) + 1,
p.adj = "holm"
)
boxplert(
log(slo),
spech.ward.gk,
xlab = "",
ylab = "log(slo)",
main = "Slope",
bcol = (1:k) + 1,
p.adj = "holm"
)
boxplert(
oxy,
spech.ward.gk,
xlab = "",
ylab = "oxy",
main = "Oxygen",
bcol = (1:k) + 1,
p.adj = "holm"
)
boxplert(
sqrt(amm),
spech.ward.gk,
xlab = "",
ylab = "sqrt(amm)",
main = "Ammonium",
bcol = (1:k) + 1,
p.adj = "holm"
)
})
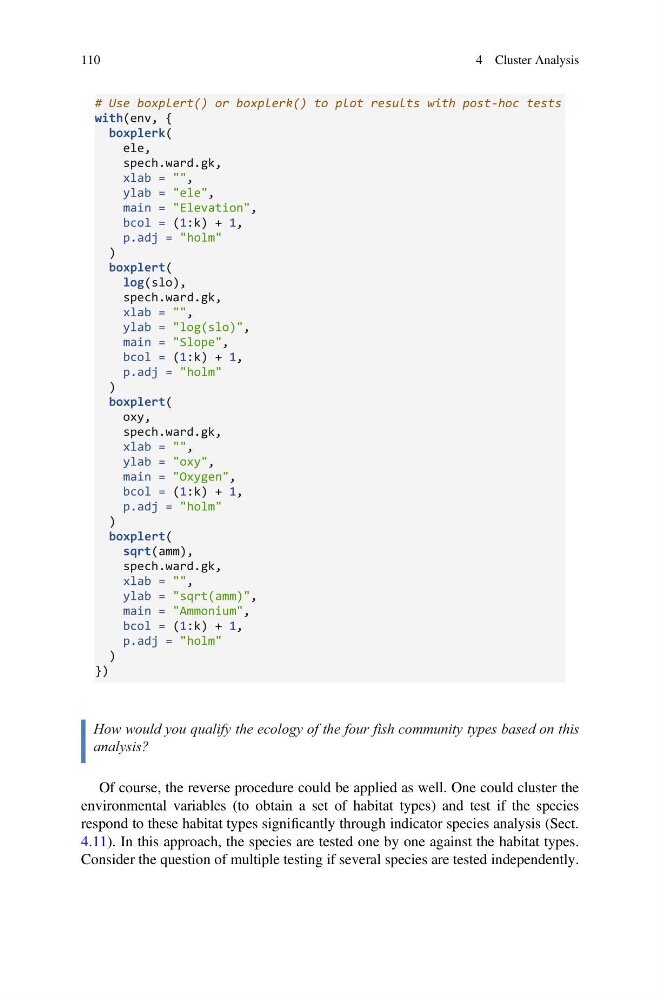
How would you qualify the ecology of the four fish community types based on this
analysis?
Of course, the reverse procedure could be applied as well. One could cluster the
environmental variables (to obtain a set of habitat types) and test if the species
respond to these habitat types significantly through indicator species analysis (Sect.
4.11). In this approach, the species are tested one by one against the habitat types.
Consider the question of multiple testing if several species are tested independently.
110
4 Cluster Analysis
with(env, {
boxplerk(
ele,
spech.ward.gk,
xlab = "",
ylab = "ele",
main = "Elevation",
bcol = (1:k) + 1,
p.adj = "holm"
)
boxplert(
log(slo),
spech.ward.gk,
xlab = "",
ylab = "log(slo)",
main = "Slope",
bcol = (1:k) + 1,
p.adj = "holm"
)
boxplert(
oxy,
spech.ward.gk,
xlab = "",
ylab = "oxy",
main = "Oxygen",
bcol = (1:k) + 1,
p.adj = "holm"
)
boxplert(
sqrt(amm),
spech.ward.gk,
xlab = "",
ylab = "sqrt(amm)",
main = "Ammonium",
bcol = (1:k) + 1,
p.adj = "holm"
)
})
How would you qualify the ecology of the four fish community types based on this
analysis?
Of course, the reverse procedure could be applied as well. One could cluster the
environmental variables (to obtain a set of habitat types) and test if the species
respond to these habitat types significantly through indicator species analysis (Sect.
4.11). In this approach, the species are tested one by one against the habitat types.
Consider the question of multiple testing if several species are tested independently.
110
4 Cluster Analysis