

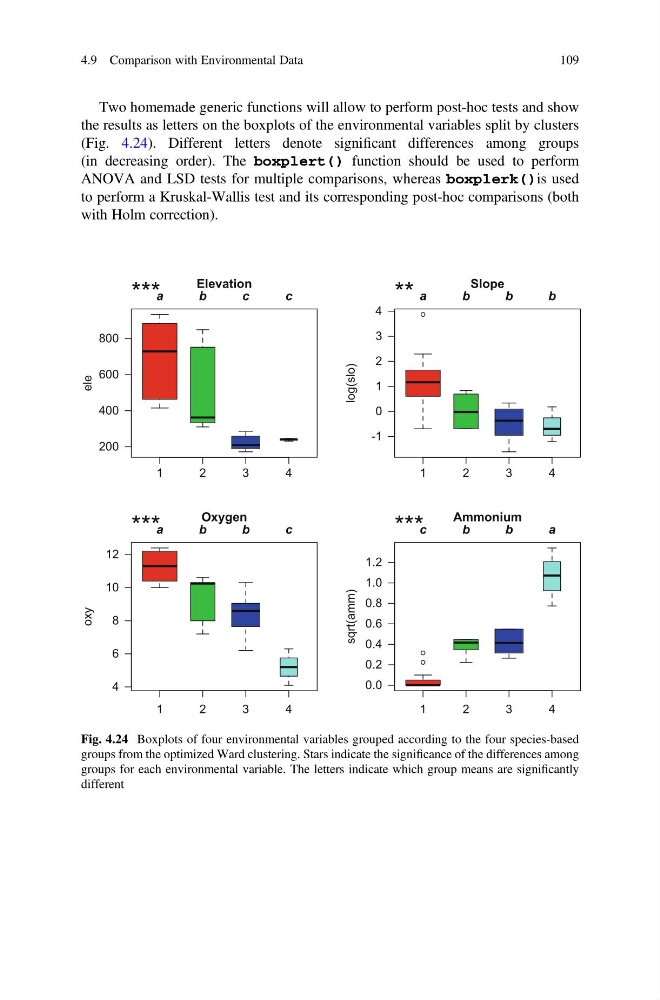
Two homemade generic functions will allow to perform post-hoc tests and show
the results as letters on the boxplots of the environmental variables split by clusters
(Fig. 4.24). Different letters denote significant differences among groups
(in decreasing order). The boxplert() function should be used to perform
ANOVA and LSD tests for multiple comparisons, whereas boxplerk()is used
to perform a Kruskal-Wallis test and its corresponding post-hoc comparisons (both
with Holm correction).
1
2
3
4
200
400
600
800
Elevation
ele
***a b c c
1
2
3
4
-1
0
1
2
3
4
Slope
log(slo)
** a b b b
1
2
3
4
4
6
8
10
12
Oxygen
oxy
***a b b c
1
2
3
4
0.0
0.2
0.4
0.6
0.8
1.0
1.2
Ammonium
sqrt(amm)
***c b b a
Fig. 4.24 Boxplots of four environmental variables grouped according to the four species-based
groups from the optimized Ward clustering. Stars indicate the significance of the differences among
groups for each environmental variable. The letters indicate which group means are significantly
different
4.9 Comparison with Environmental Data
109
the results as letters on the boxplots of the environmental variables split by clusters
(Fig. 4.24). Different letters denote significant differences among groups
(in decreasing order). The boxplert() function should be used to perform
ANOVA and LSD tests for multiple comparisons, whereas boxplerk()is used
to perform a Kruskal-Wallis test and its corresponding post-hoc comparisons (both
with Holm correction).
1
2
3
4
200
400
600
800
Elevation
ele
***a b c c
1
2
3
4
-1
0
1
2
3
4
Slope
log(slo)
** a b b b
1
2
3
4
4
6
8
10
12
Oxygen
oxy
***a b b c
1
2
3
4
0.0
0.2
0.4
0.6
0.8
1.0
1.2
Ammonium
sqrt(amm)
***c b b a
Fig. 4.24 Boxplots of four environmental variables grouped according to the four species-based
groups from the optimized Ward clustering. Stars indicate the significance of the differences among
groups for each environmental variable. The letters indicate which group means are significantly
different
4.9 Comparison with Environmental Data
109