

As an alternative, ordination-based multivariate approaches will be proposed in
Chap. 6 to directly model and test the species-habitat relationships.
4.9.2 Comparing Two Typologies (Contingency Table
Approach)
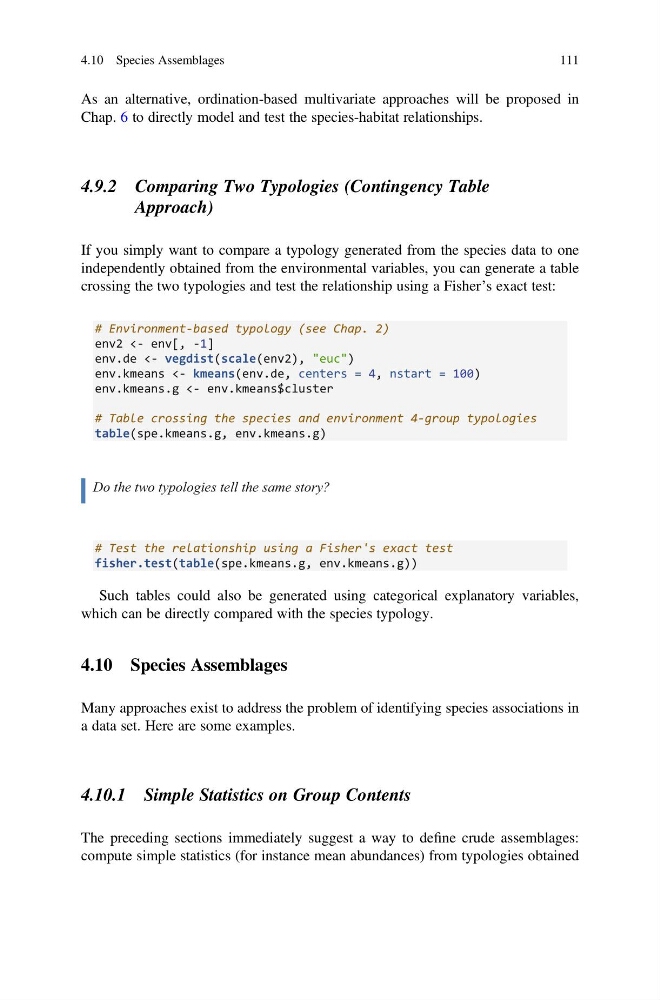
If you simply want to compare a typology generated from the species data to one
independently obtained from the environmental variables, you can generate a table
crossing the two typologies and test the relationship using a Fisher’s exact test:
# Environment-based typology (see Chap. 2)
env2 <- env[, -1]
env.de <- vegdist(scale(env2), "euc")
env.kmeans <- kmeans(env.de, centers = 4, nstart = 100)
env.kmeans.g <- env.kmeans$cluster
# Table crossing the species and environment 4-group typologies
table(spe.kmeans.g, env.kmeans.g)
Do the two typologies tell the same story?
# Test the relationship using a Fisher's exact test
fisher.test(table(spe.kmeans.g, env.kmeans.g))
Such tables could also be generated using categorical explanatory variables,
which can be directly compared with the species typology.
4.10 Species Assemblages
Many approaches exist to address the problem of identifying species associations in
a data set. Here are some examples.
4.10.1 Simple Statistics on Group Contents
The preceding sections immediately suggest a way to define crude assemblages:
compute simple statistics (for instance mean abundances) from typologies obtained
4.10 Species Assemblages
111
Chap. 6 to directly model and test the species-habitat relationships.
4.9.2 Comparing Two Typologies (Contingency Table
Approach)
If you simply want to compare a typology generated from the species data to one
independently obtained from the environmental variables, you can generate a table
crossing the two typologies and test the relationship using a Fisher’s exact test:
# Environment-based typology (see Chap. 2)
env2 <- env[, -1]
env.de <- vegdist(scale(env2), "euc")
env.kmeans <- kmeans(env.de, centers = 4, nstart = 100)
env.kmeans.g <- env.kmeans$cluster
# Table crossing the species and environment 4-group typologies
table(spe.kmeans.g, env.kmeans.g)
Do the two typologies tell the same story?
# Test the relationship using a Fisher's exact test
fisher.test(table(spe.kmeans.g, env.kmeans.g))
Such tables could also be generated using categorical explanatory variables,
which can be directly compared with the species typology.
4.10 Species Assemblages
Many approaches exist to address the problem of identifying species associations in
a data set. Here are some examples.
4.10.1 Simple Statistics on Group Contents
The preceding sections immediately suggest a way to define crude assemblages:
compute simple statistics (for instance mean abundances) from typologies obtained
4.10 Species Assemblages
111