

An Index for Terata-Based Assessment
95
0 ....
70 -
....... Larvae
60 -
and fry
50 -
40
20
v30
10
Iuveniles
and adults
0
0
10
20
30
40
50
60
70
80
90
Deformed fish (%)
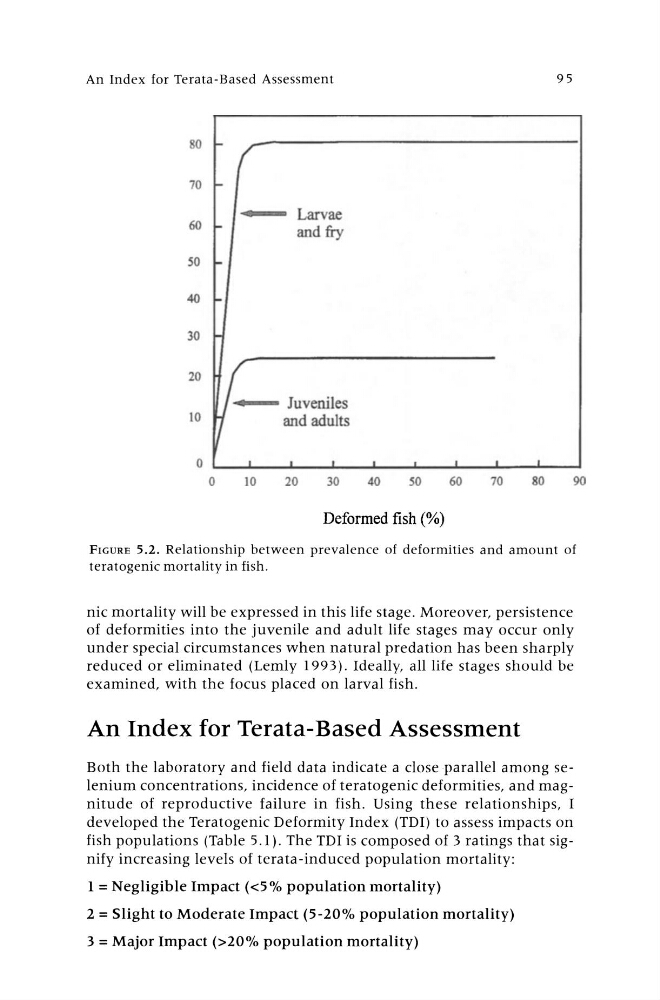
FIGURE 5.2. Relationship between prevalence of deformities and amount of
teratogenic mortality in fish .
nic mortality will be expressed in this life stage. Moreover, persistence
of deformities into the juvenile and adult life stages may occur only
under special circumstances when natural predation has been sharply
reduced or eliminated (Lemly 1993). Ideally, all life stages should be
examined, with the focus placed on larval fish.
An Index for Terata-Based Assessment
Both the laboratory and field data indicate a close parallel among selenium concentrations, incidence of teratogenic deformities, and magnitude of reproductive failure in fish. Using these relationships, I
developed the Teratogenic Deformity Index (TDI) to assess impacts on
fish populations (Table 5.1). The TDI is composed of 3 ratings that signify increasing levels of terata-induced population mortality:
1 =Negligible Impact «5% population mortality)
2 =Slight to Moderate Impact (5-20% population mortality)
3 =Major Impact (>20% population mortality)
95
0 ....
70 -
....... Larvae
60 -
and fry
50 -
40
20
v30
10
Iuveniles
and adults
0
0
10
20
30
40
50
60
70
80
90
Deformed fish (%)
FIGURE 5.2. Relationship between prevalence of deformities and amount of
teratogenic mortality in fish .
nic mortality will be expressed in this life stage. Moreover, persistence
of deformities into the juvenile and adult life stages may occur only
under special circumstances when natural predation has been sharply
reduced or eliminated (Lemly 1993). Ideally, all life stages should be
examined, with the focus placed on larval fish.
An Index for Terata-Based Assessment
Both the laboratory and field data indicate a close parallel among selenium concentrations, incidence of teratogenic deformities, and magnitude of reproductive failure in fish. Using these relationships, I
developed the Teratogenic Deformity Index (TDI) to assess impacts on
fish populations (Table 5.1). The TDI is composed of 3 ratings that signify increasing levels of terata-induced population mortality:
1 =Negligible Impact «5% population mortality)
2 =Slight to Moderate Impact (5-20% population mortality)
3 =Major Impact (>20% population mortality)